



• Intro & Last Edition Recap:
In Edition No. 6 [08/09/2026] we reviewed the TOTAL3ES structure and found that not much had changed for Alts since June.
Well, ALL BETS ARE NOW OFF.
There is now a very high probability [75-80%] that the end of the Bear Market cycle has already occurred, and the very beginning of the 2026 Bull Market has begun for Crypto. We are in a midterm election year, and the last time this exact scenario began unfolding was late 2022. We all know what happened from then on.
If you believe the Crypto 4-year cycle has been broken, think again. So far history continues playing out in near perfect order.
I mean seriously… how long did you think the Stock Market could erupt higher and higher while Crypto remained this underpriced? Virtually every single Crypto ticker has gone vertical since Wednesday, the 19th August.
DO YOU THINK YOU’VE ALREADY MISSED IT ANON?! NOT EVEN CLOSE.
Do not panic enter, do not FOMO long. There will be many opportunities to buy back into support structures, and this weekend is the first meaningful area to do so.
LET’S DIVE IN!
• First things first; TOTAL3ES & STABLE.C.D:
I said LOUDLY and often that a chart like TOTAL3ES–
(which is Crypto’s TOTAL Market Cap Excluding BTC, ETH AND Stablecoins)
–had a very high probability of breaking up or down violently, and my intuition was always that [based on the macro backdrop] there was a much higher probability of breaking to the upside here, rather than the downside.
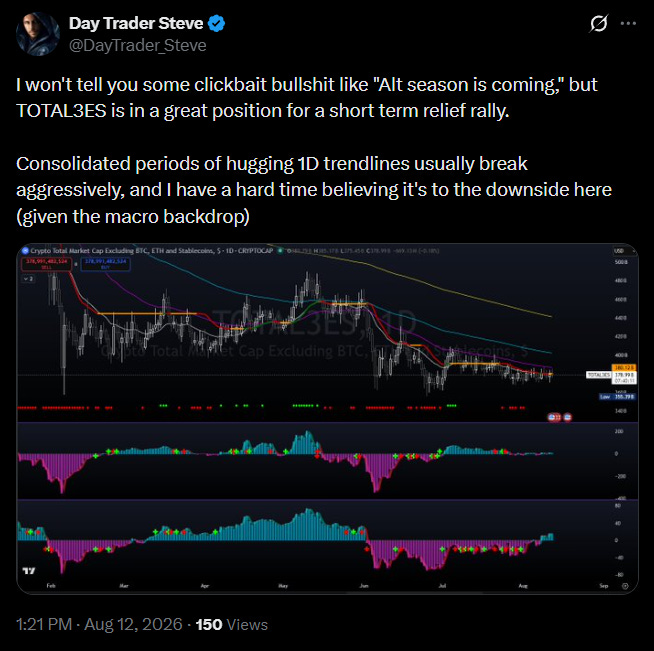
On August 12th I laid the groundwork for what was coming - I will always keep receipts and admit when I’m wrong.
So if you aren’t following me on X yet, you’re missing the PRIMARY place I share all of my trade setups. My Newsletter is great for the macro view, but it isn’t going to help you against the most important component of swing trading; TIME.
Setups in Crypto are here and gone in hours. If you’re reading this 24hrs late, you’ve likely missed the majority of a fresh move. But, that’s the purpose of this article - to shed light on likely pullback zones so you can get in before the next leg higher begins.
This pullback zone may very well be available -ONLY- this weekend.
The confirmation chart which is a mandatory complement to TOTAL3ES for measuring true regime change, is STABLE.C.D–
(which measures the market wide dominance of all Stablecoins such as USDT, USDC etc.)
–when combined, it tells us more than either chart could alone. We have a very clear Daily breakout on TOTAL3ES, and an equally clear breakdown on STABLE.C.D:
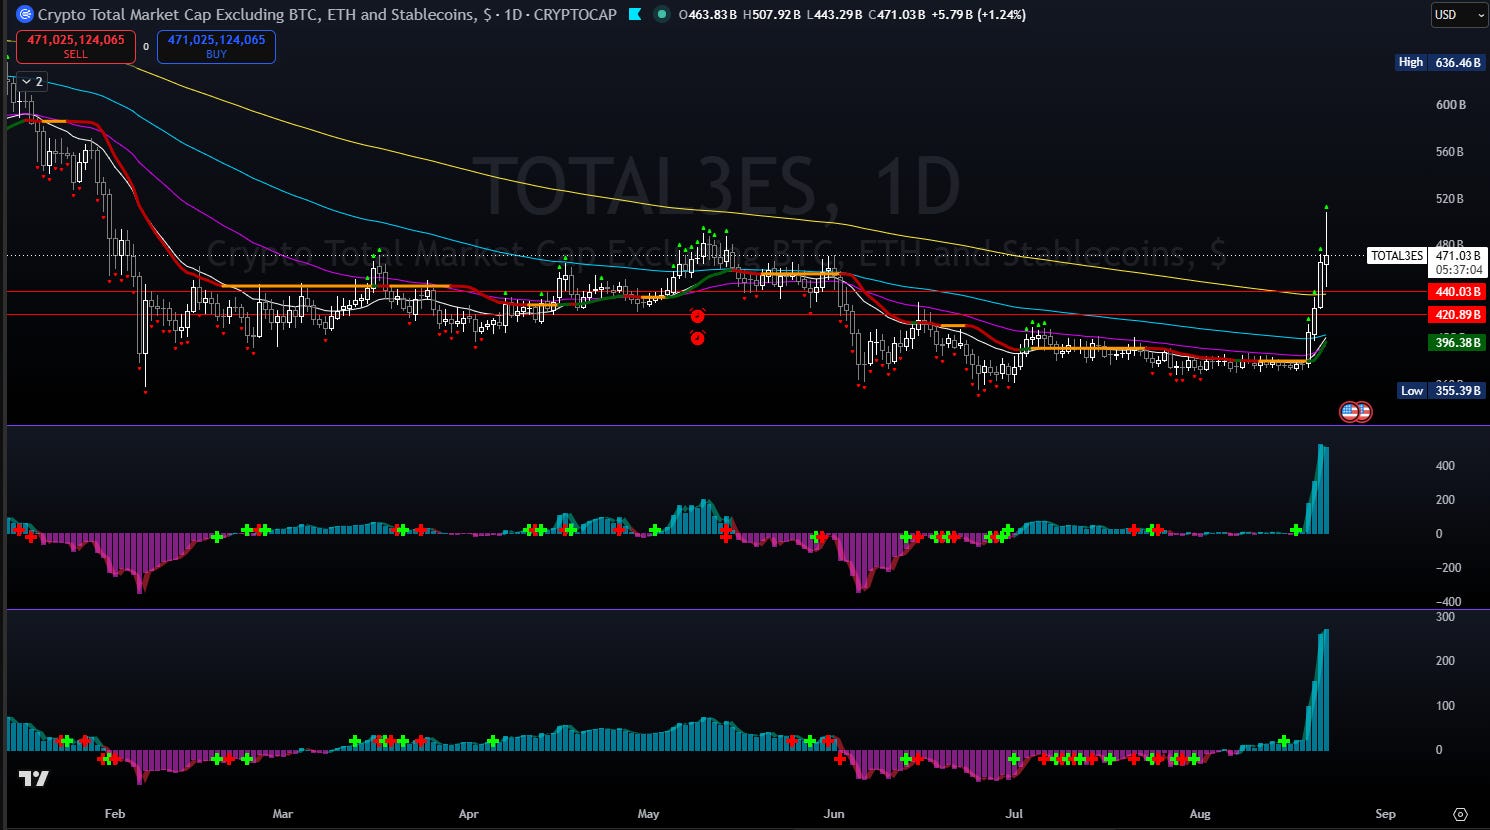
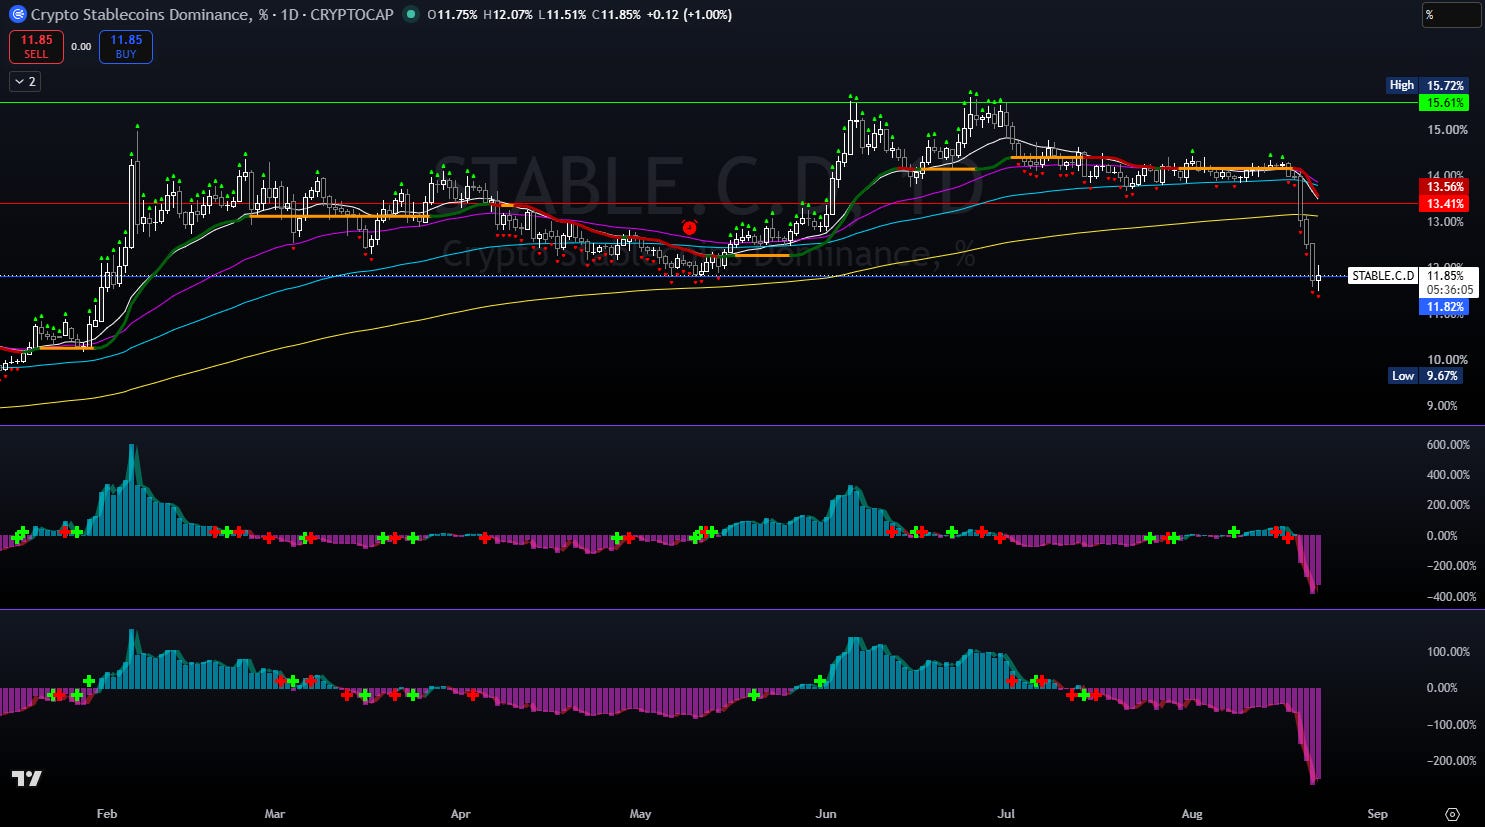
That is extraordinarily meaningful contemporaneous evidence towards legitimate regime change. This is not just a corrective higher low inside a bear structure. This is market wide, violent repricing.
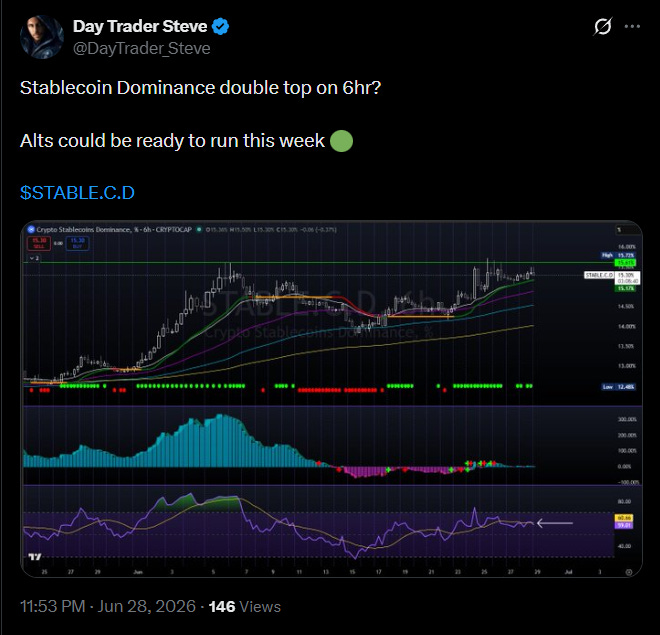
For those following me on X, you know I also called for the STABLE.C.D “Double Top” back in late June. While premature, the structure was in fact a confirmed double top.
• So what’s the Pullback Zone?
When you begin potential market-wide regime change like this, you need to zoom the fuck out. Micro timeframes like 15m or 1hr aren’t going to tell you anything meaningful. You need to live and breathe on the Weekly and Daily chart structures.
Looking at the Weekly charts for both TOTAL3ES and STABLE.C.D, paints a pretty clear picture in my view:
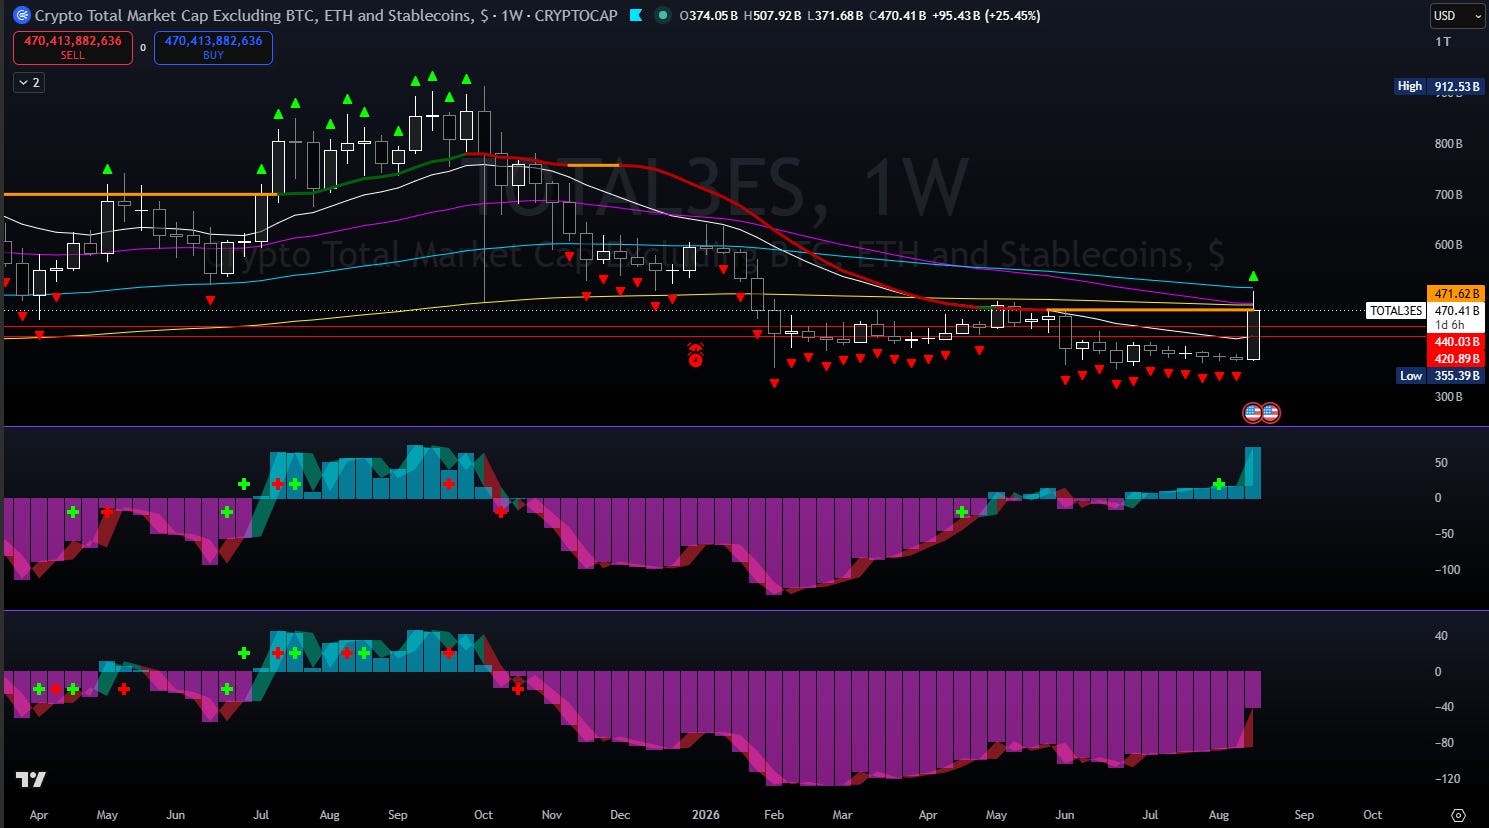
There is enormous confluence across current price and the EMA cluster above our Trendline region at approx. ~$470B. It is the 200W EMA and 50W EMA intersection. If we close this week ANYWHERE above the 20W EMA of ~$420B, that is an outrageously BULLISH signal. You can see from the wick we’ve already poked ~$510B and re-traced back into the Trendline. That is violent expansion! It is therefore completely normal behavior to wick back under, and remains structurally valid for continuation higher.
If for some reason (low probability) we closed this week < ~$420B, you can start arguing for the case of a “failed breakout attempt.”
Not bloody likely!
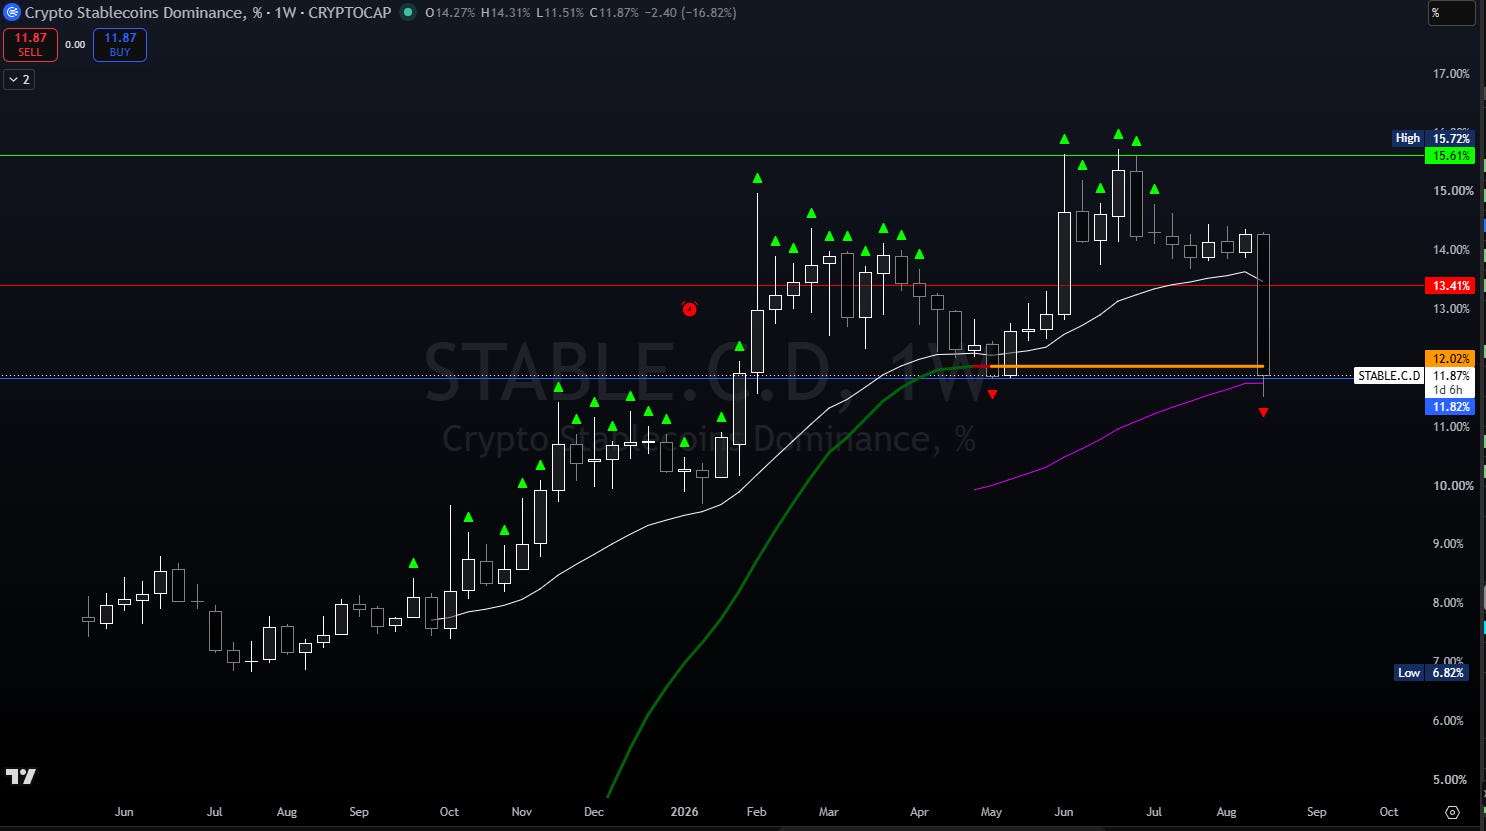
Enter the Stablecoin chart. This is what provides materially higher confirmation of true regime change. Stables have been decimated in one week, falling from 14.30% dominance to just under 12% at trendline, and a touch above our 50W EMA.
A bounce from this support zone would be completely normal (and is to be expected) without invalidating any HTF structure. You can see we’ve already poked down into 11.51% and have slightly re-traced back up to 11.87%
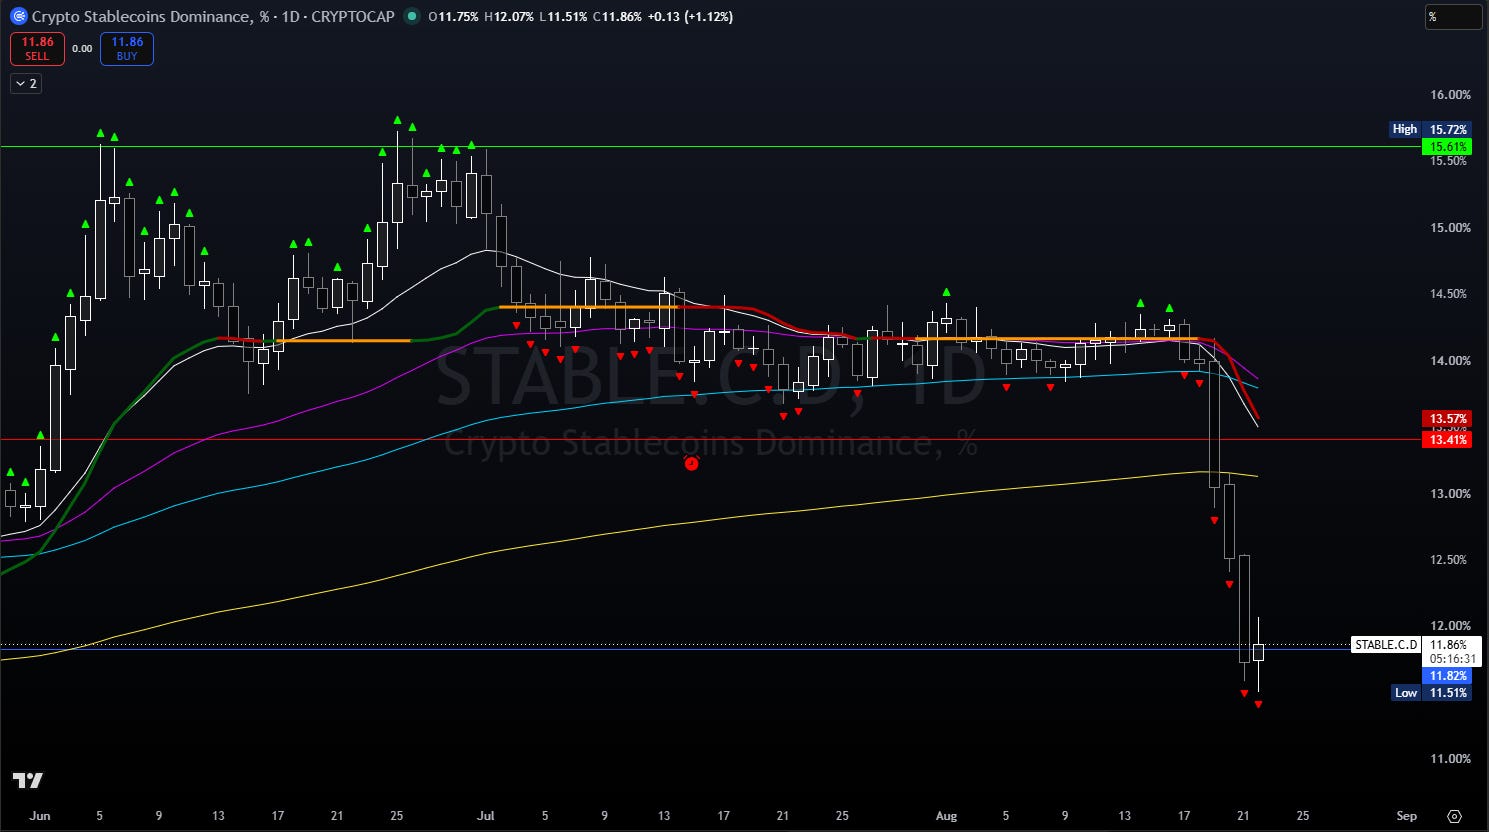
When you look at the Daily chart, it becomes even more clear. Even if we bounced up into trendline resistance back at ~13 to ~14%, nothing changes. You can absolutely have Stable dominance rising while Alts and Crypto MCAP also expands.
The line in the sand here is if we start closing back above 14% and it recovers, turning the zone back into support. We are fine as long as this level acts as RESISTANCE or sell supply.
Let’s look at the market leaders for even further clarity:
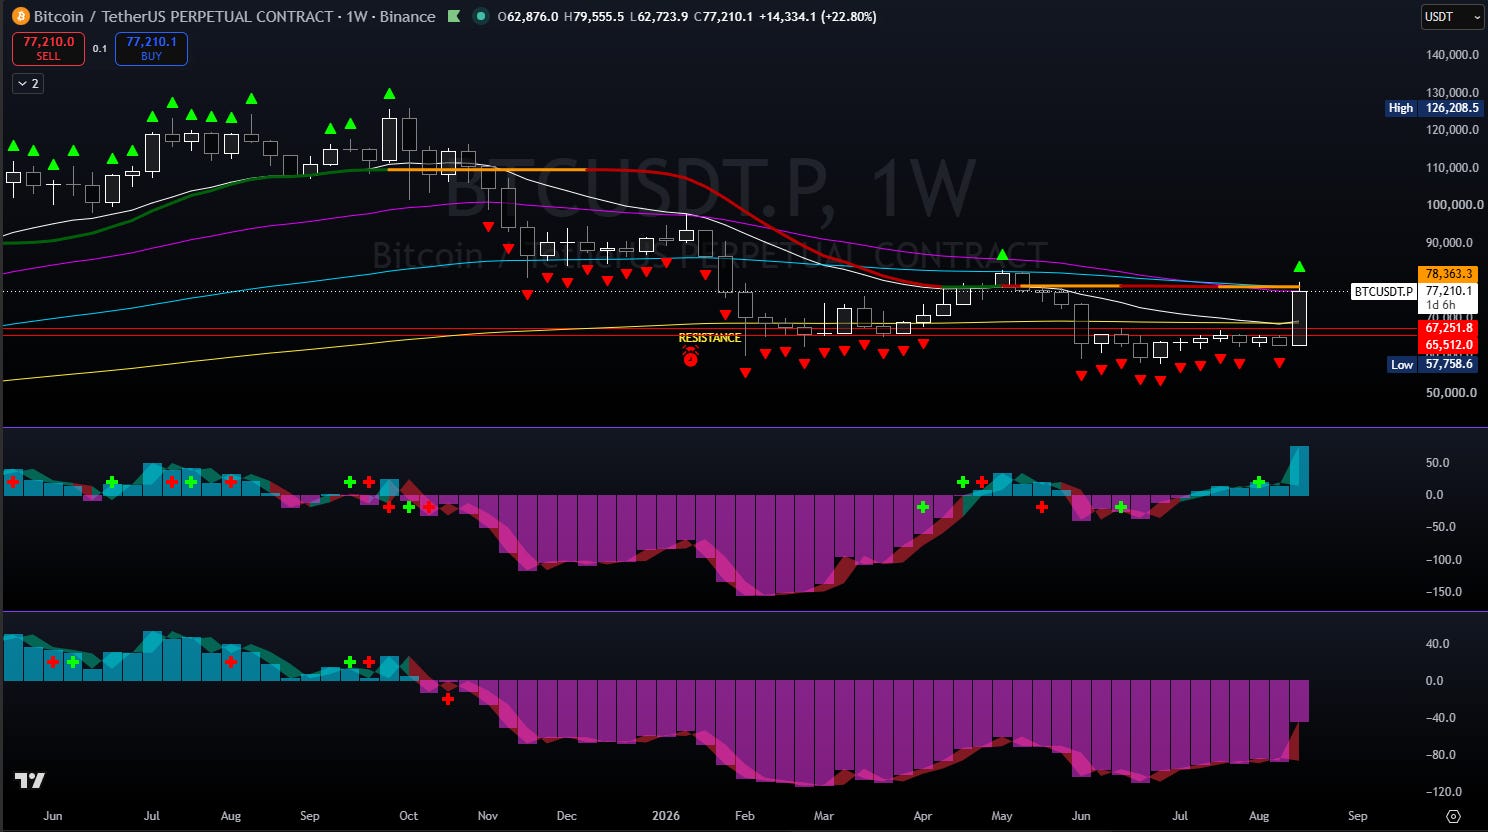
BTC weekly looks identical to TOTAL3ES. Huge weekly breakout candle, already beyond the 200W EMA and pushing directly into the trendline and 100W / 50W EMA intersection. A weekly close anywhere above ~69k is enormously bullish for Crypto as a whole.
Dare I say it; THE BOTTOM IS IN!!! (Maybe)
Our fast TSICCI indicator has confirmed bullish expansion and is ~30hrs away from printing a confirmed weekly bull cross + signal. The slow TSICCI has simultaneously curled up rapidly this week from -85 to -42.7
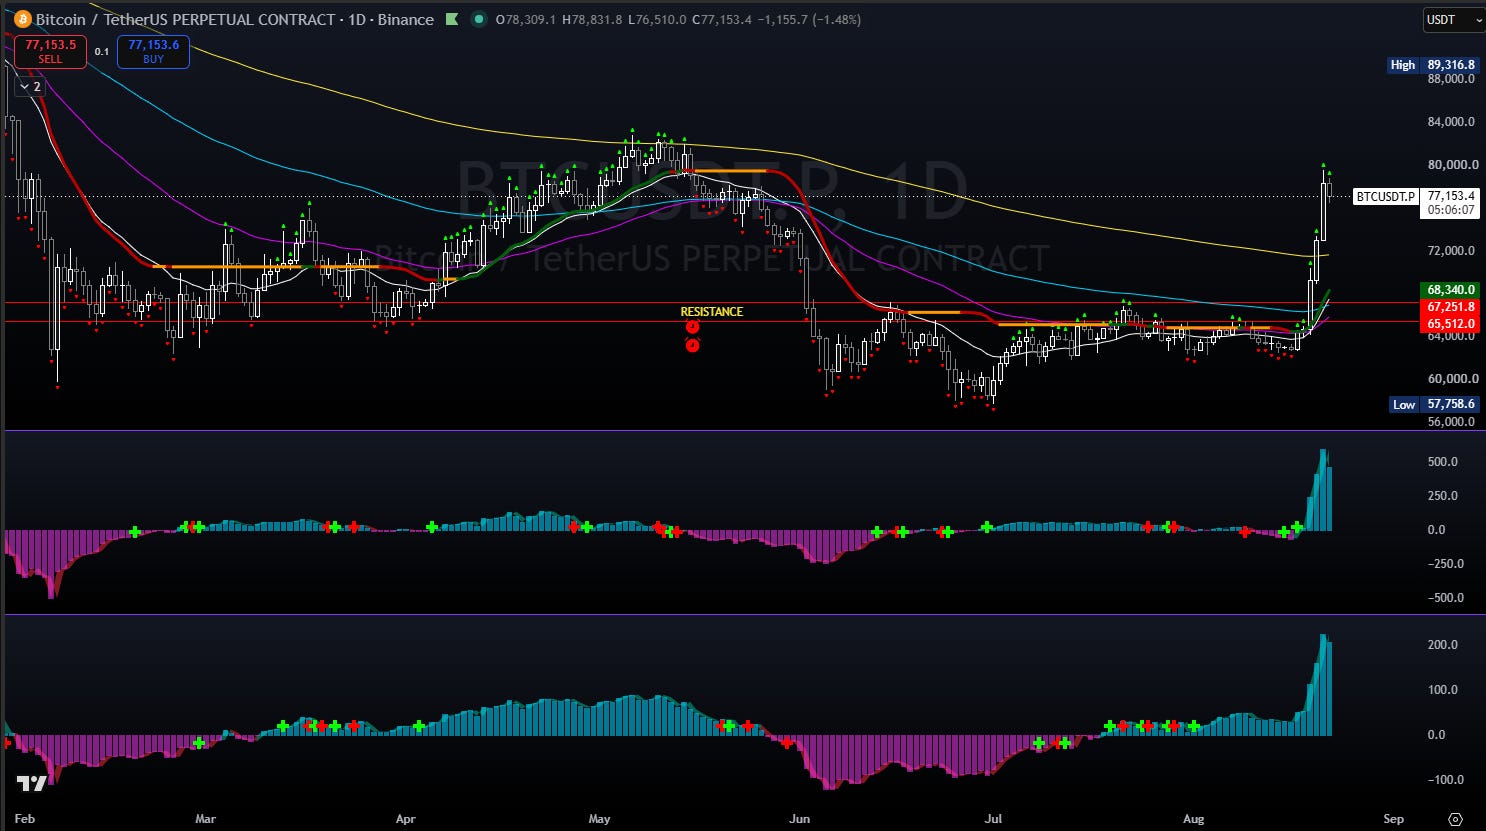
The Daily BTC chart is showing a very obvious breakout trend and is well above the 200D EMA. We could experience some turbulence as we go through the prior local high range of ~82k, but there is no guarantee of resistance during a bull regime shift.
VERY possible for price to smash through it–you can see it’s done that exact thing through the 200D without experiencing any resistance whatsoever. MEGA bullish signal.
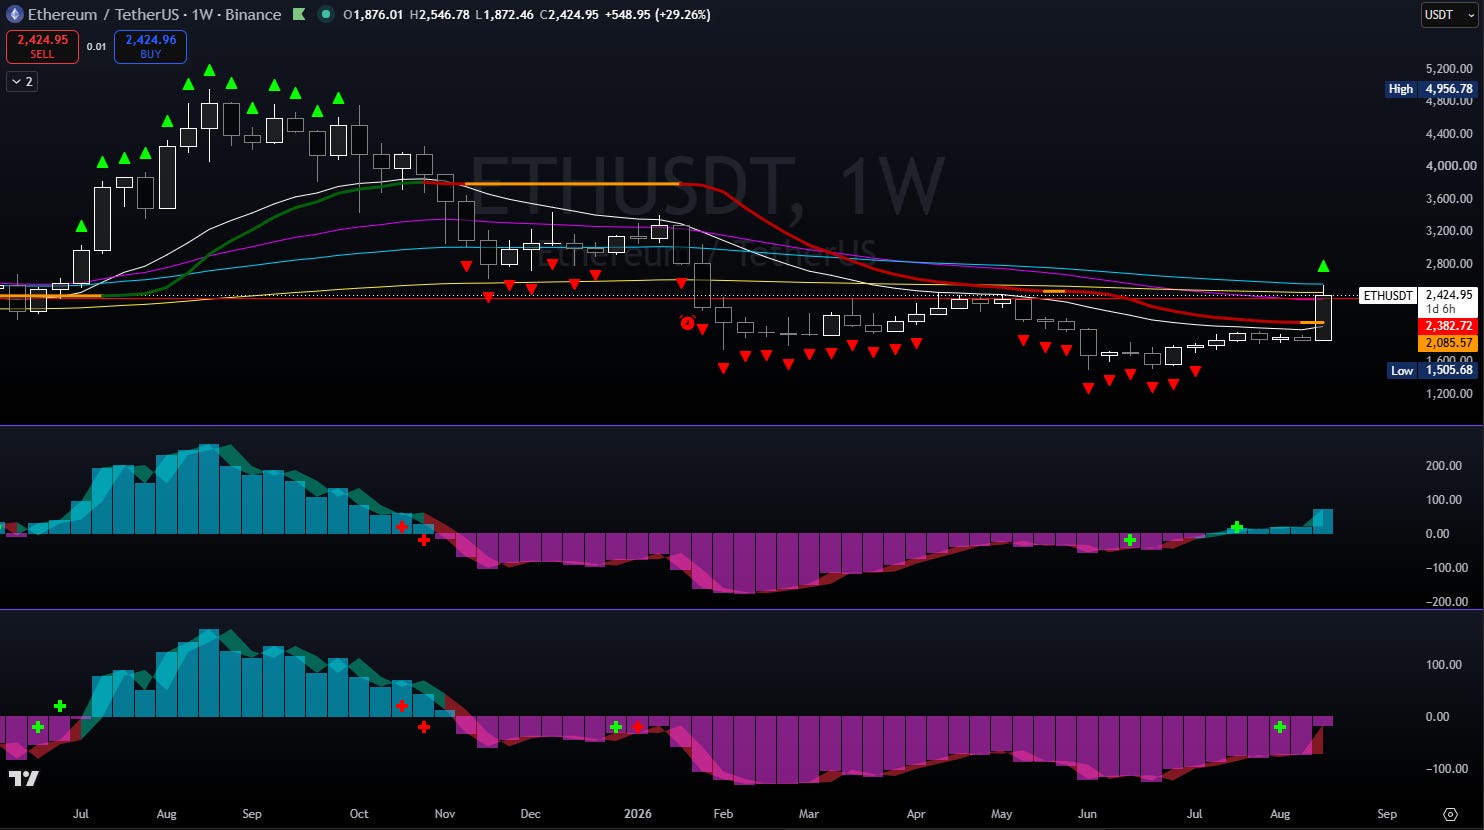
On to ETH… Practically identical Weekly chart. That’s 3 for 3… You can see why I’m calling this market wide regime change.
Huge breakout directly into weekly EMA cluster where the 200W and 100W EMA sit. We are already well above the 20EMA and Trendline. Our fast TSICCI indicator has been a confirmed bull cross + signal since Aug 03, and our slow TSICCI is attempting to print the first bottom bull cross +.
ETH closing the week anywhere above ~2100 is very bullish for Crypto and Alts.
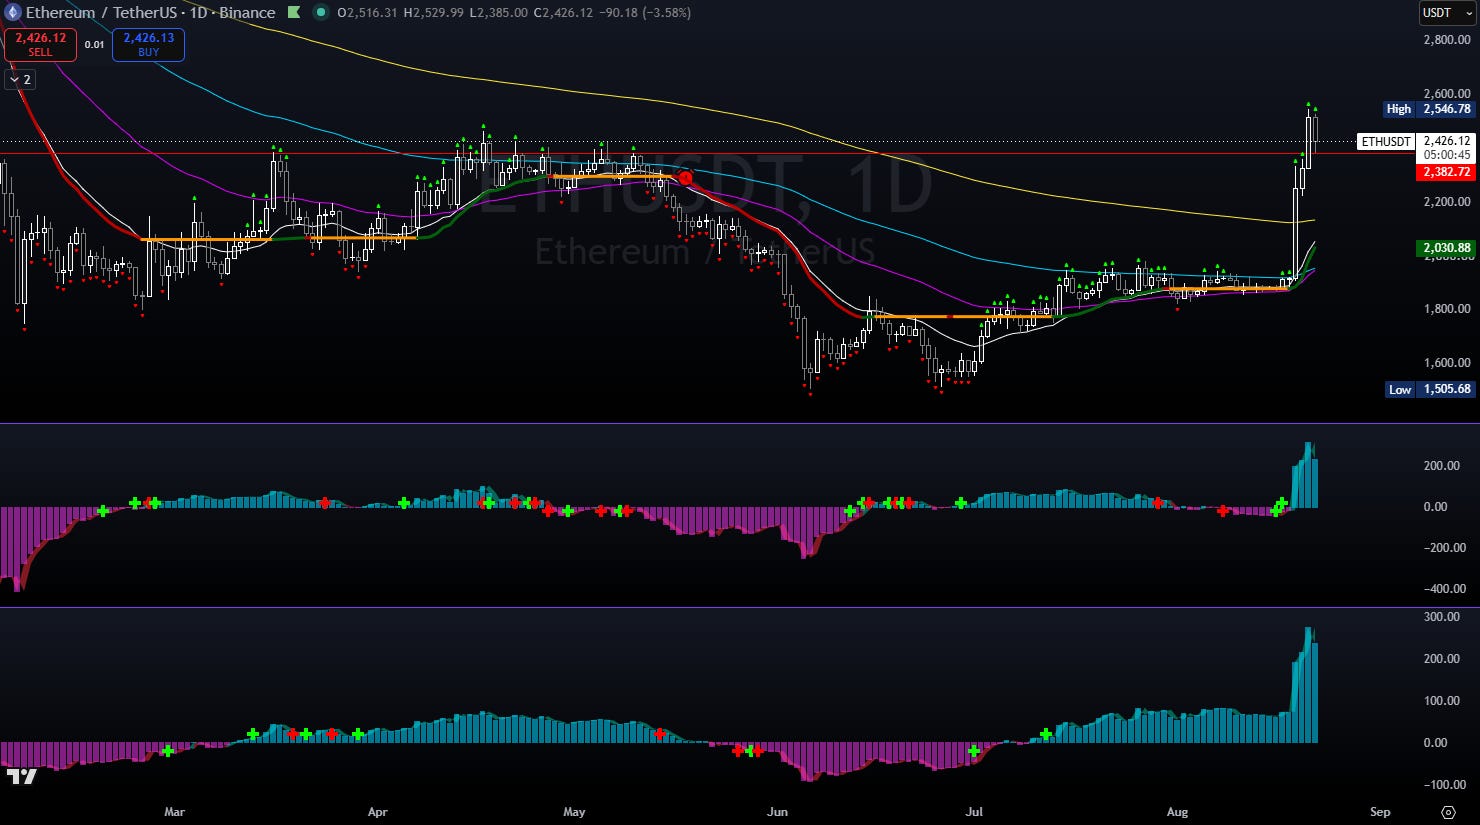
Looking at ETH daily is even more clear. This is a violent ERUPTION beyond 200D EMA stack. The previous local high range of ~2400 is already showing attempts at being made into support.
I gave this setup away for FREE from ~$1920 [+26%] on August 17th:
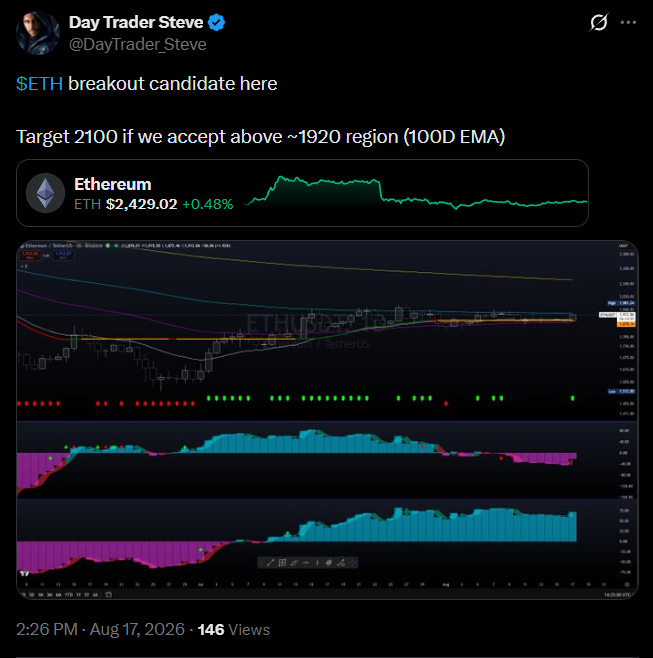
If ~2400 was heavily rejected we could argue for a potential weaker expansion or maybe even a failed breakout attempt. The fact that 200D EMA showed absolutely no resistance AND the prior level is already being turned into support is an unbelievable signal of strength.
• Additional Market Leaders and Outperformers:
I will share the charts which are simply undeniable based on the past 4 days of price action. First up is ZEC:
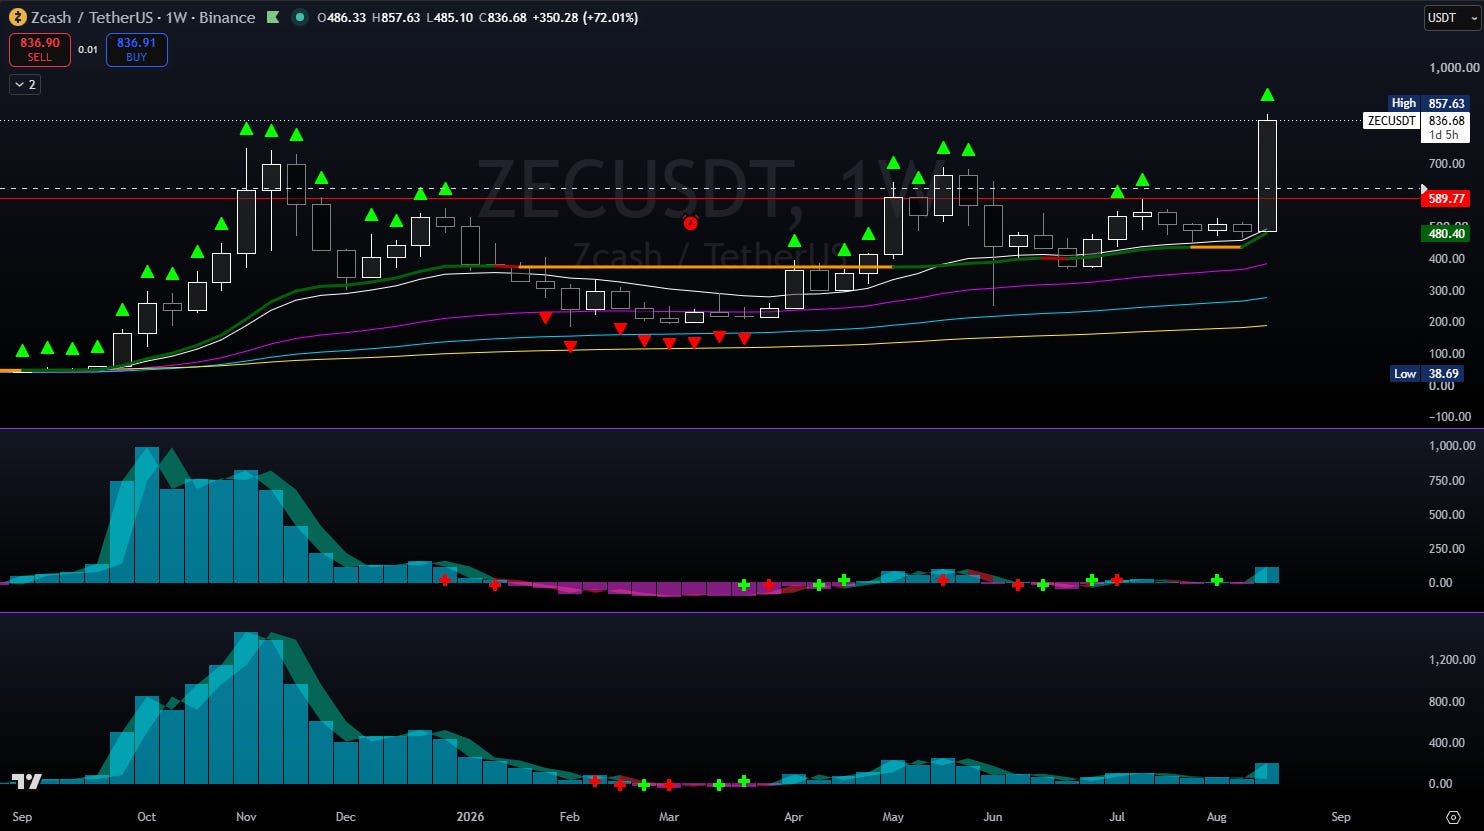
It does not get more bullish than this. I’m in a 4x long from ~$516 and I’ve already taken partial profit. I’m now leaving a substantial runner on the heels of the ZEC ETF announcement.
PS I’m a huge fan of Gareth Soloway (Verified Investing), if you’re not hooked into his side of things I strongly recommend it!

This is a runaway freight train of a chart–if you’re not already in, you can try hunting a wick such as the one we saw on this 4hr chart around 1am ET today–or on 1hr support zones. The sheer momentum of ZEC will be hard to pin down, so depending on your leverage and size it might be worth chasing. As always, risk management is crucial here.
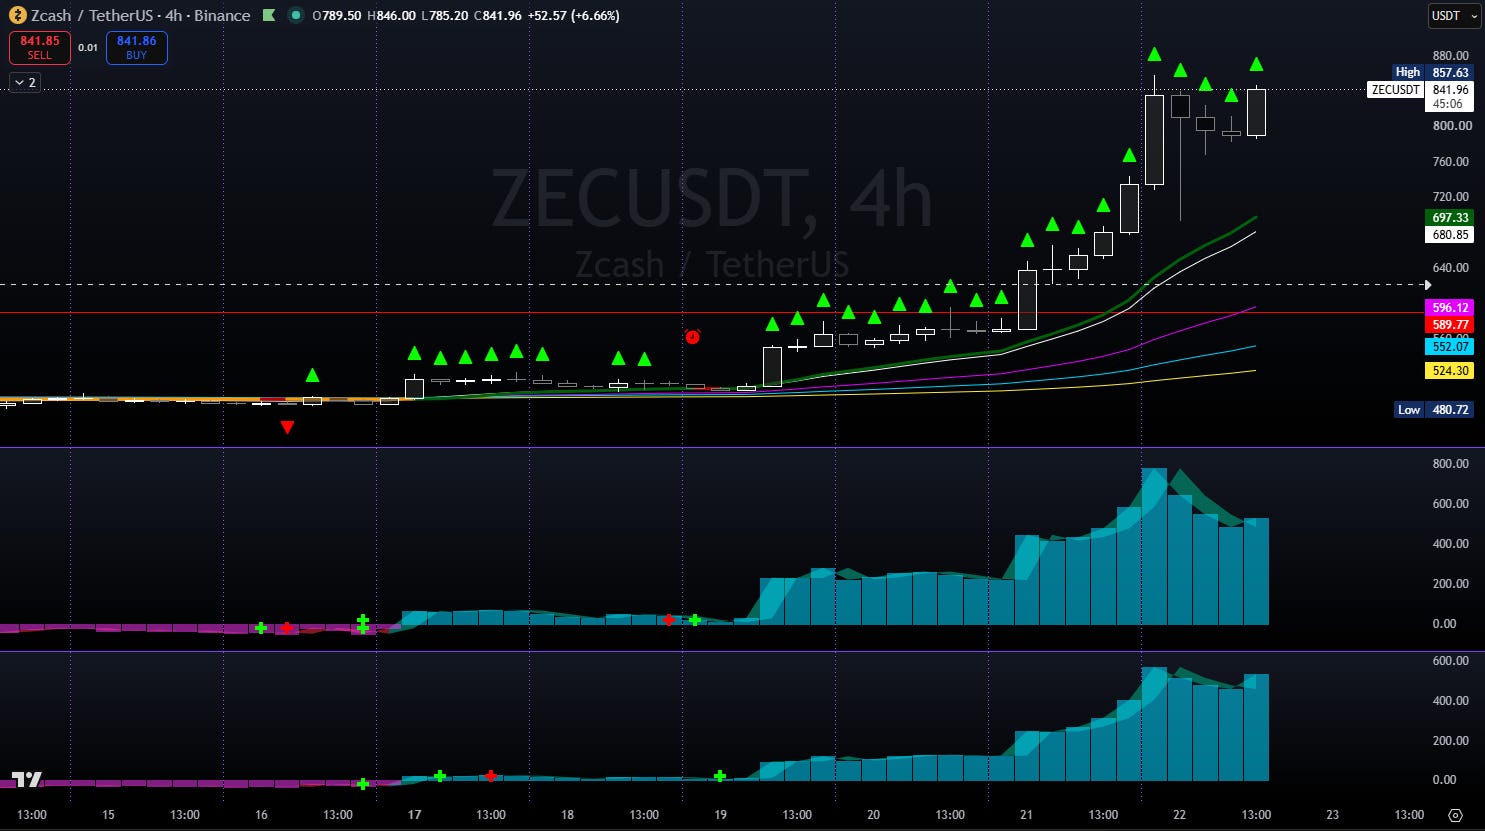
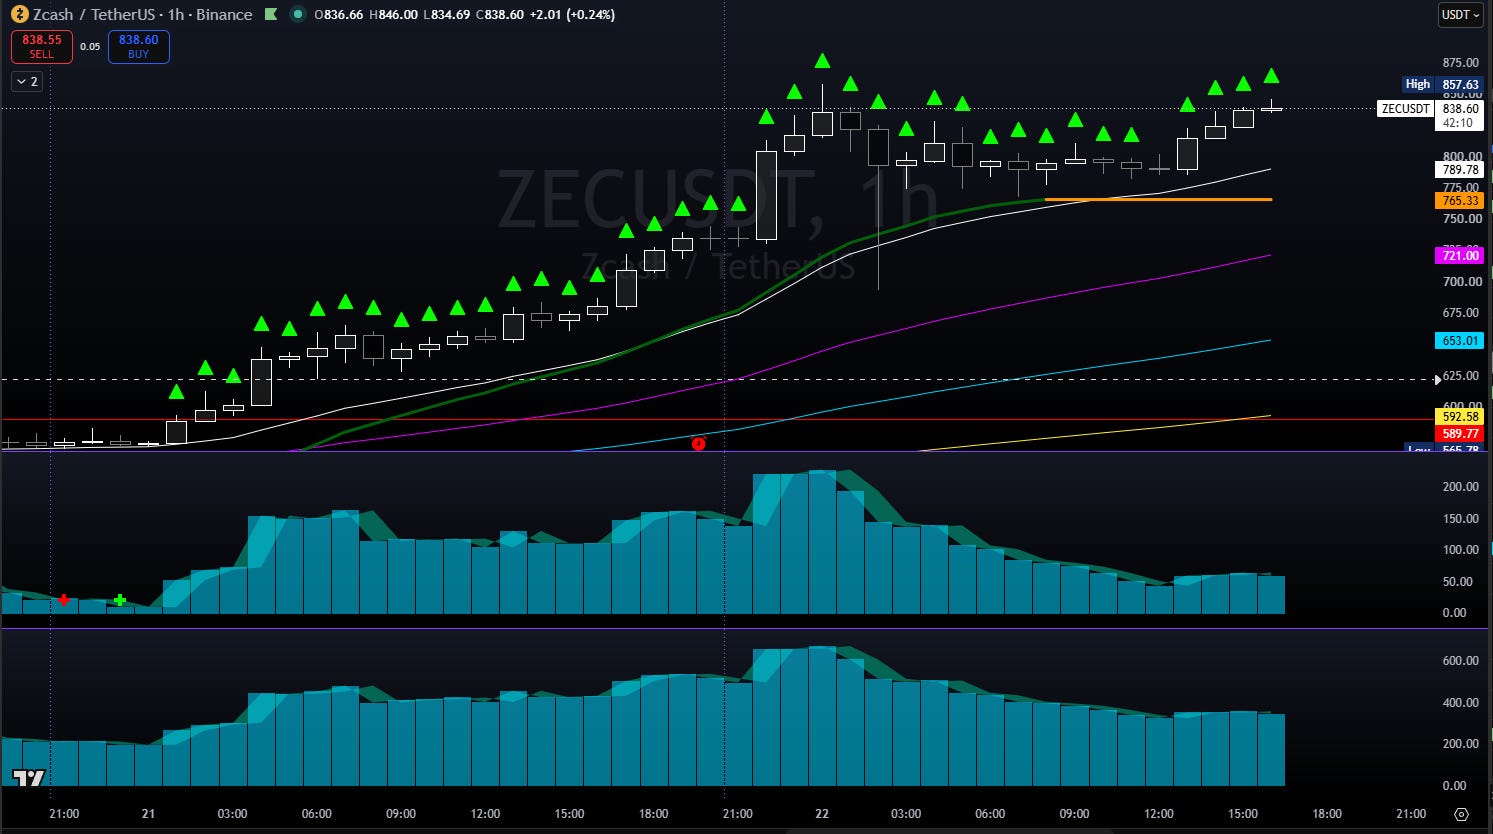
Buying anything around < ~800 was the zone today. Early bird gets the worm!
Next up is LINK:
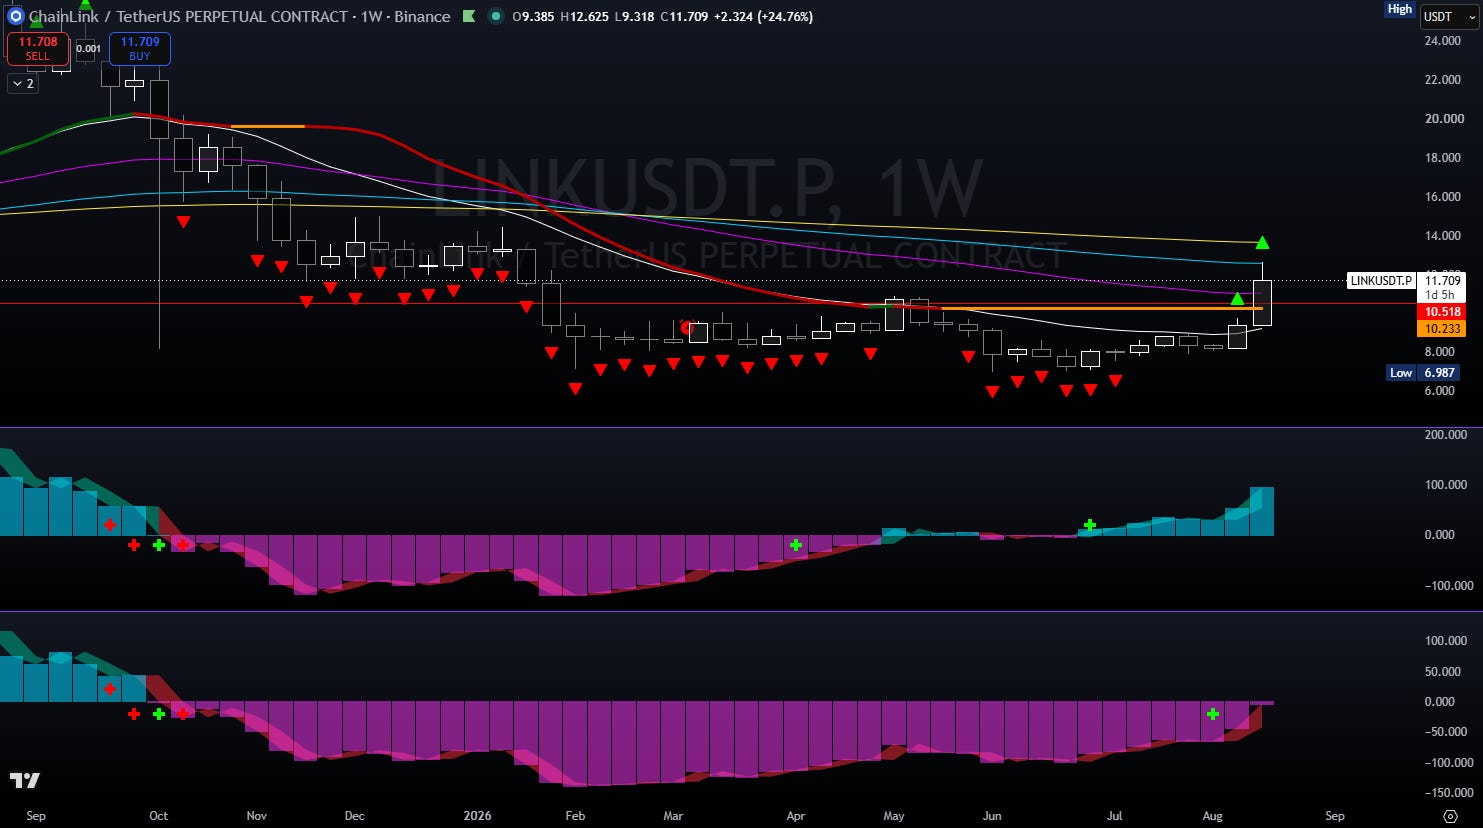
Already confirmed week #2 with a green dot, well above 20W EMA and trendline. Poked 100W EMA at $12.60 and rejected slightly. If this thing closes tomorrow anywhere above ~$10.70 it’s outrageously bullish.
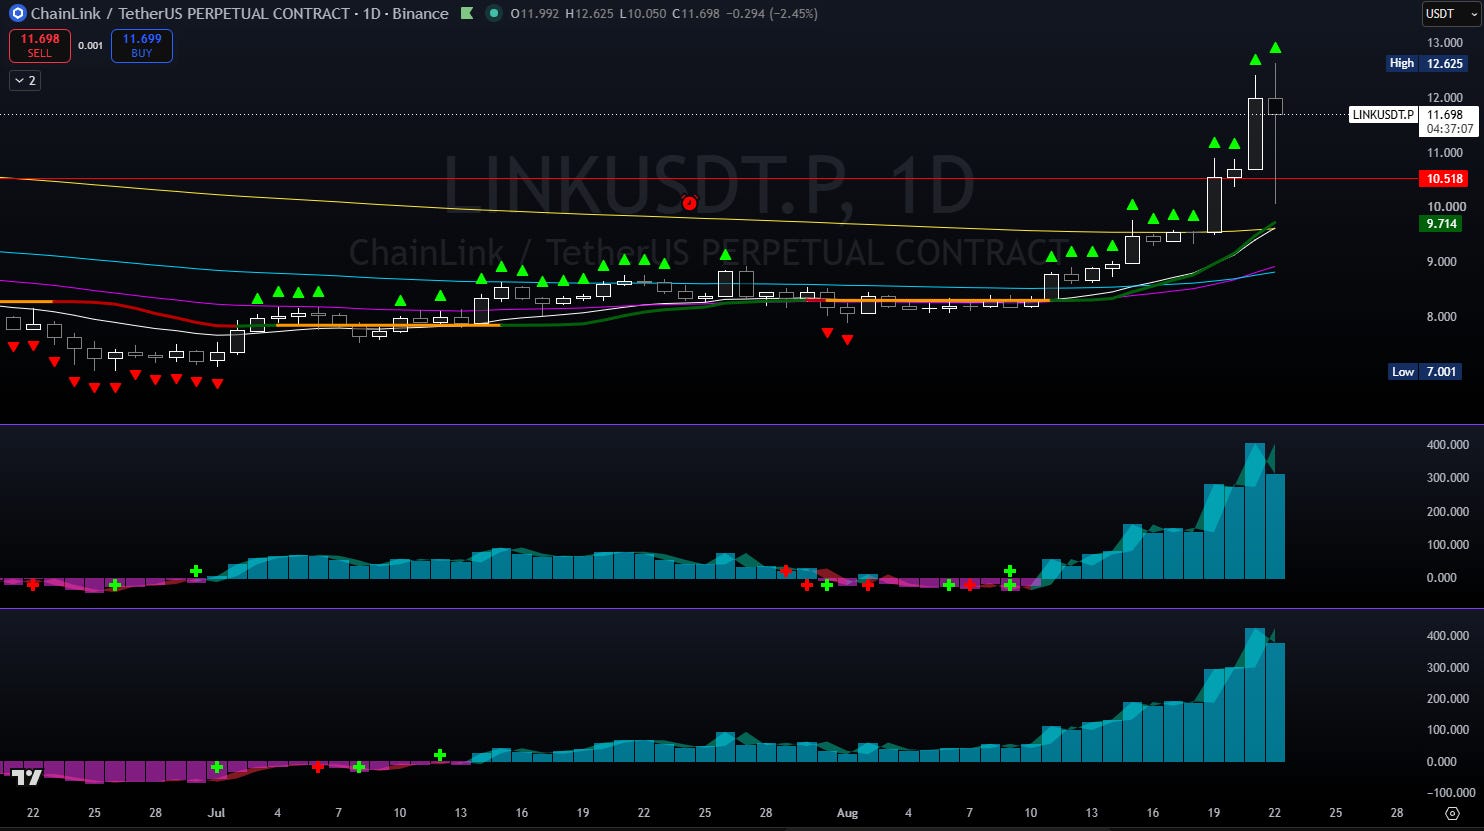
You can see on Daily we’ve already had a flush wick, similar to ZEC. This is how Alts work baby. It’s why you need wide stops if you’re playing with leverage, which means you need exceptionally strong entries and asymmetry.
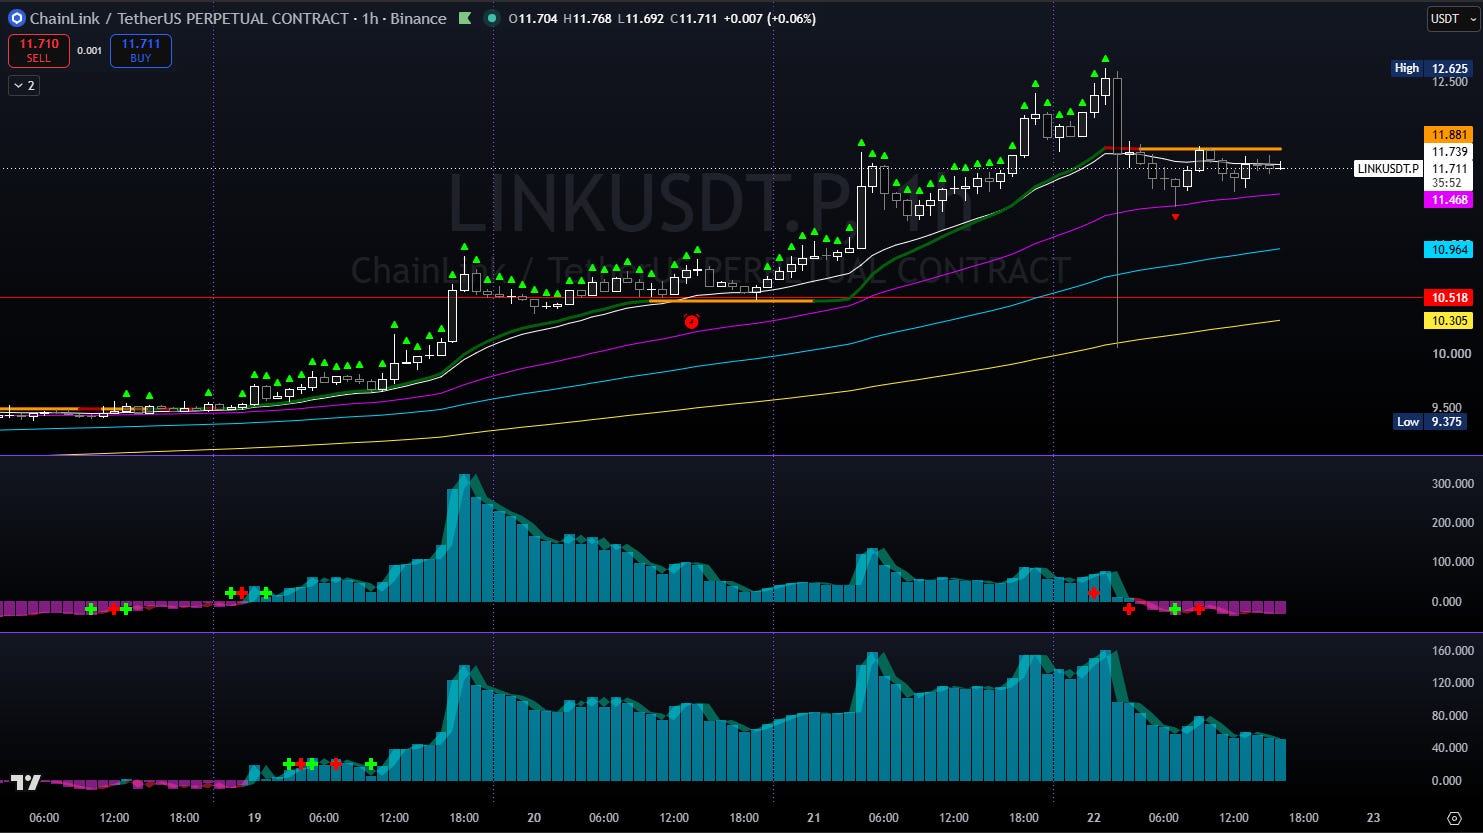
Wicks will differ per exchange and liquidity / trading volume, but if you were a buyer anywhere around 1am ET today on that 1hr 200EMA retest, you have a great asymmetric entry price.
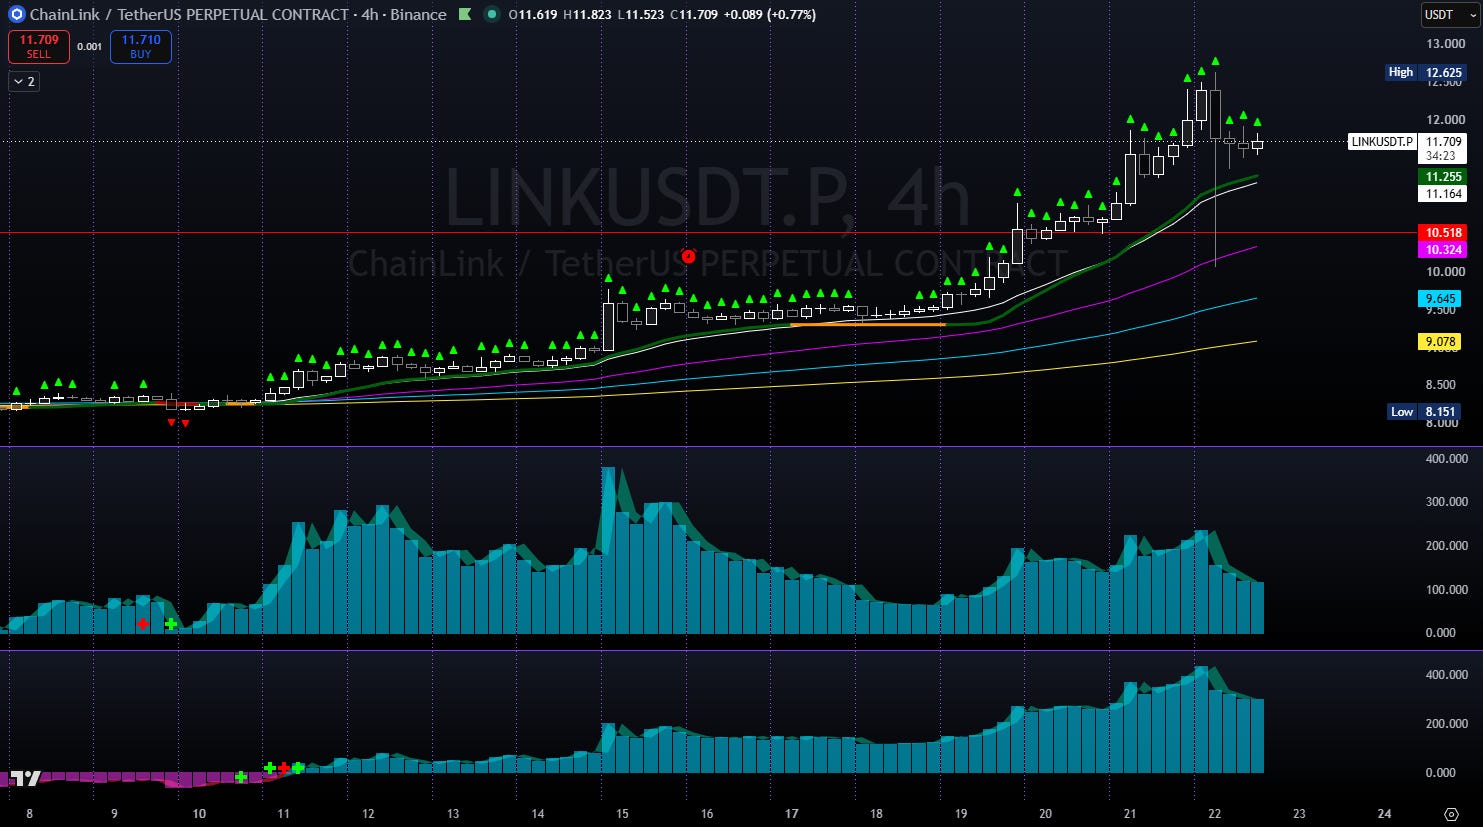
I don’t currently love the 1hr structure just underneath trendline and 20 EMA, but the 4hr is still very much in tact. Best case scenario here would be a few days basing around these prices and setting up a support zone. I’m in a 5x long from $9.57 and my SL is still entered at $9.32 because of these Alt wicks. They are fucking NASTY.
If you can catch one–they act as great entries during a bull run regime change. If LINK starts losing $11.25 and fails to reclaim it, I will likely substantially kill my trade and wait for the next setup. This is crypto, setups happen every single week.
Next up is HYPE–this is a foolish chart:
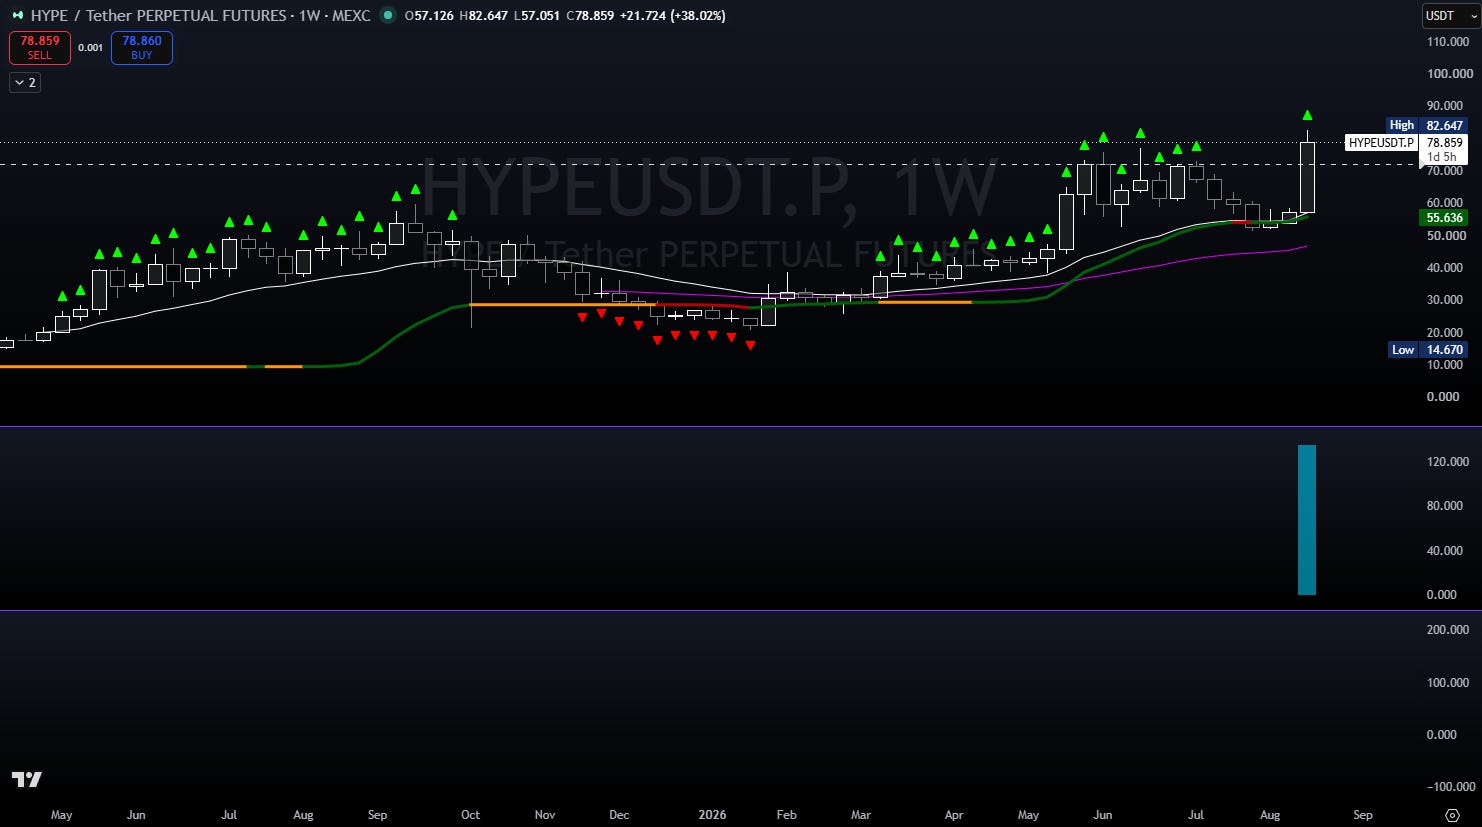
I might almost argue this is more bullish than ZEC because this is true ATH territory for HYPE, whereas ZEC is technically still down -99% lifetime.
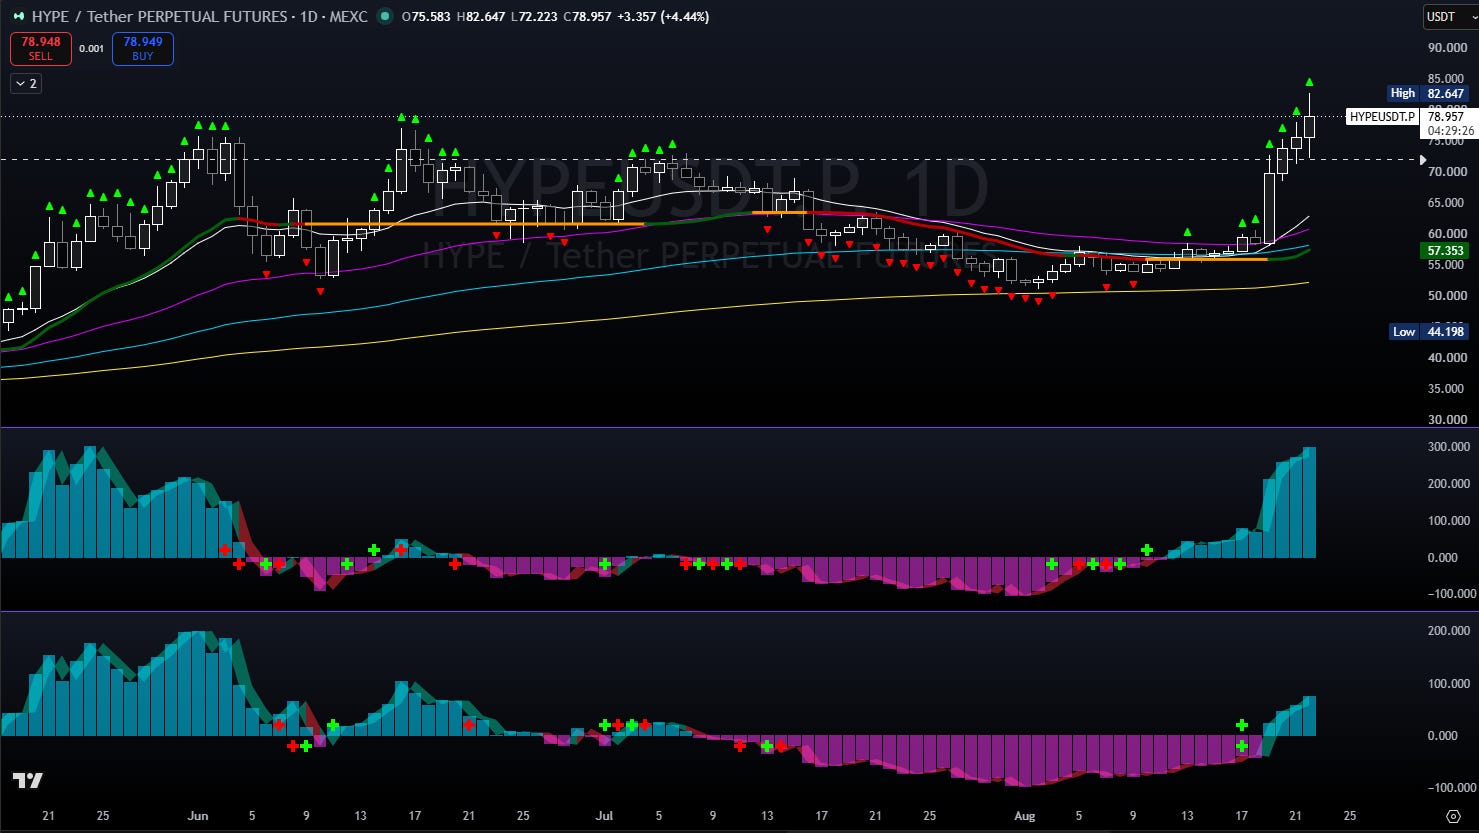
The daily is ALREADY trying to close over the previous ATH of ~76.70
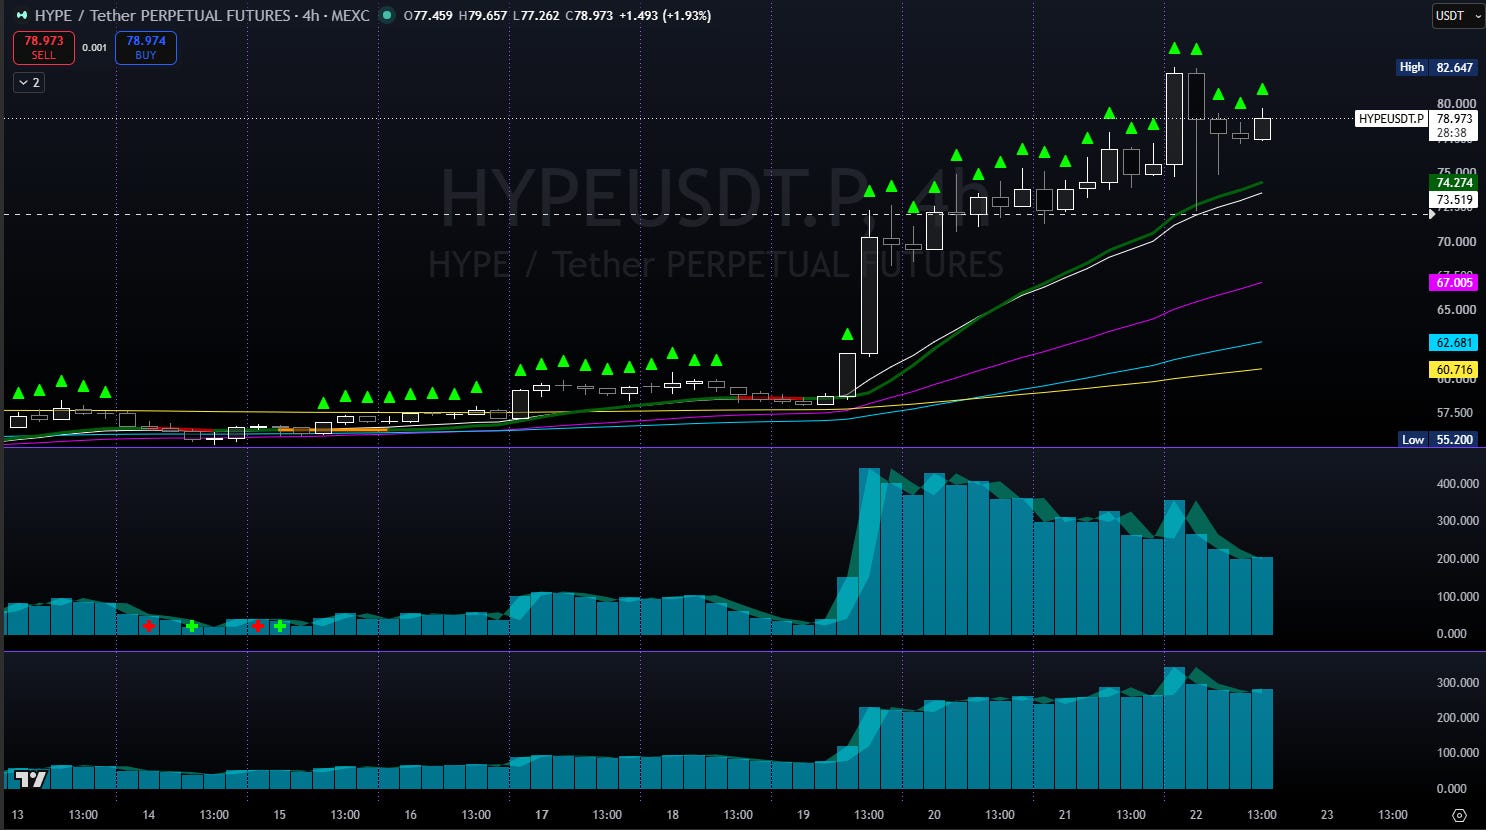
The 4hr gave us a small pullback into trendline and 20 EMA around 1am ET this morning, that was your chance. But I like it here as well. Frankly, given the ATH pricing, HYPE is about to discover an air pocket. You can probably chase here fairly safely.
Again, risk management.
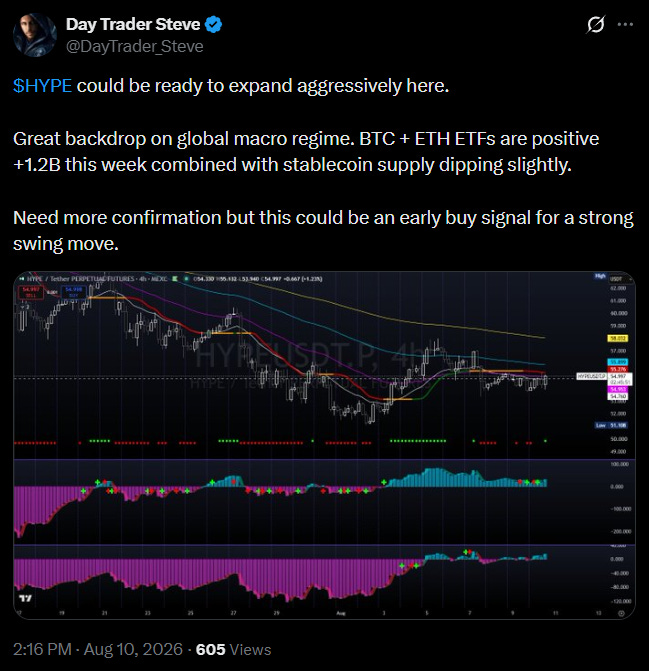
I gave you this entry from ~$55 for FREE [+42%] on August 10th:
• In Conclusion:
Outside of exposure to ZEC, LINK, & HYPE, I am heavily long ETH, SOL, XLM, TRX, DASH and ONDO.
Of those tickers, I am particularly impressed by the relative strength of HYPE, ZEC, LINK, XLM and DASH. Those 5 are running harder than almost anything right now.
Exposure to ETH and SOL is of course critical as they are the market Alt leaders, but end of the day we are simply trying to extract USD and compound the portfolio to buy more spot Bitcoin.
You’ll notice I’m not typically swing trading BTC, and that is nothing other than a chart cleanliness issue. It tends to be less clear than ETH or SOL for my indicator toolkit. Since ETH and SOL are the largest high beta Alts, when they look good it’s fairly easy to anticipate even higher-beta setups. That’s where violent moves happen, and it’s how you extract the most money from the markets.
KEY LEVELS:
• BTC ~69K
• ETH ~2100
• TOTAL3ES ~440B, ~420B
• STABLE.C.D < 14%
Losing any of these levels would make me very uncomfortable, and I’d consider killing the majority of my exposure.
If you’re not following me on X yet what are you waiting for? You could’ve been long ETH from ~$1910 and HYPE from ~$55.
If I’m correct and we’re starting a fresh Bull Run, there will be many opportunities over the following weeks and months. Using EMA zones to reload during price pullbacks is how you attack this market.
The vast majority of my Trade setups will be shared via X or in my free discord community The Heron Room.
As always, Trade Smart, Reduce Your Risk, and Stay Safe!
— DTS
Part of Great Blue Digital
www.greatbluedigital.ca
www.daytradersteve.com