

Day Trader Steve — Market Flow Newsletter No. 04
[Everyone screaming it's OVER, what if this is actually the BOTTOM?]

• Intro & Last Edition Recap:
A lot has happened in the Crypto market since my October 27th issue; most critically $BTC has been in free-fall since I pointed out several key resistance levels over the past month. Had you simply gone SHORT since Bitcoin poked our $117k resistance level on 10/27, you’d have made a nice 25-30% ROI. +1% ROI per day isn’t bad (if you can capture it).
Last edition I mentioned from a [purely technical perspective I would not open a “set it and forget it” long position] on Bitcoin, as we were seeing a Daily EMA death cross. This is when the 20D EMA crosses down through the 200D EMA. Price ultimately poked the 200D EMA and trendline, before rejecting it AGAIN, and riding the waterslide down from $108k to the low of $80k. You can also see how much more extended the death cross EMA stacks are, with price riding well underneath it.
$BTC 1D:
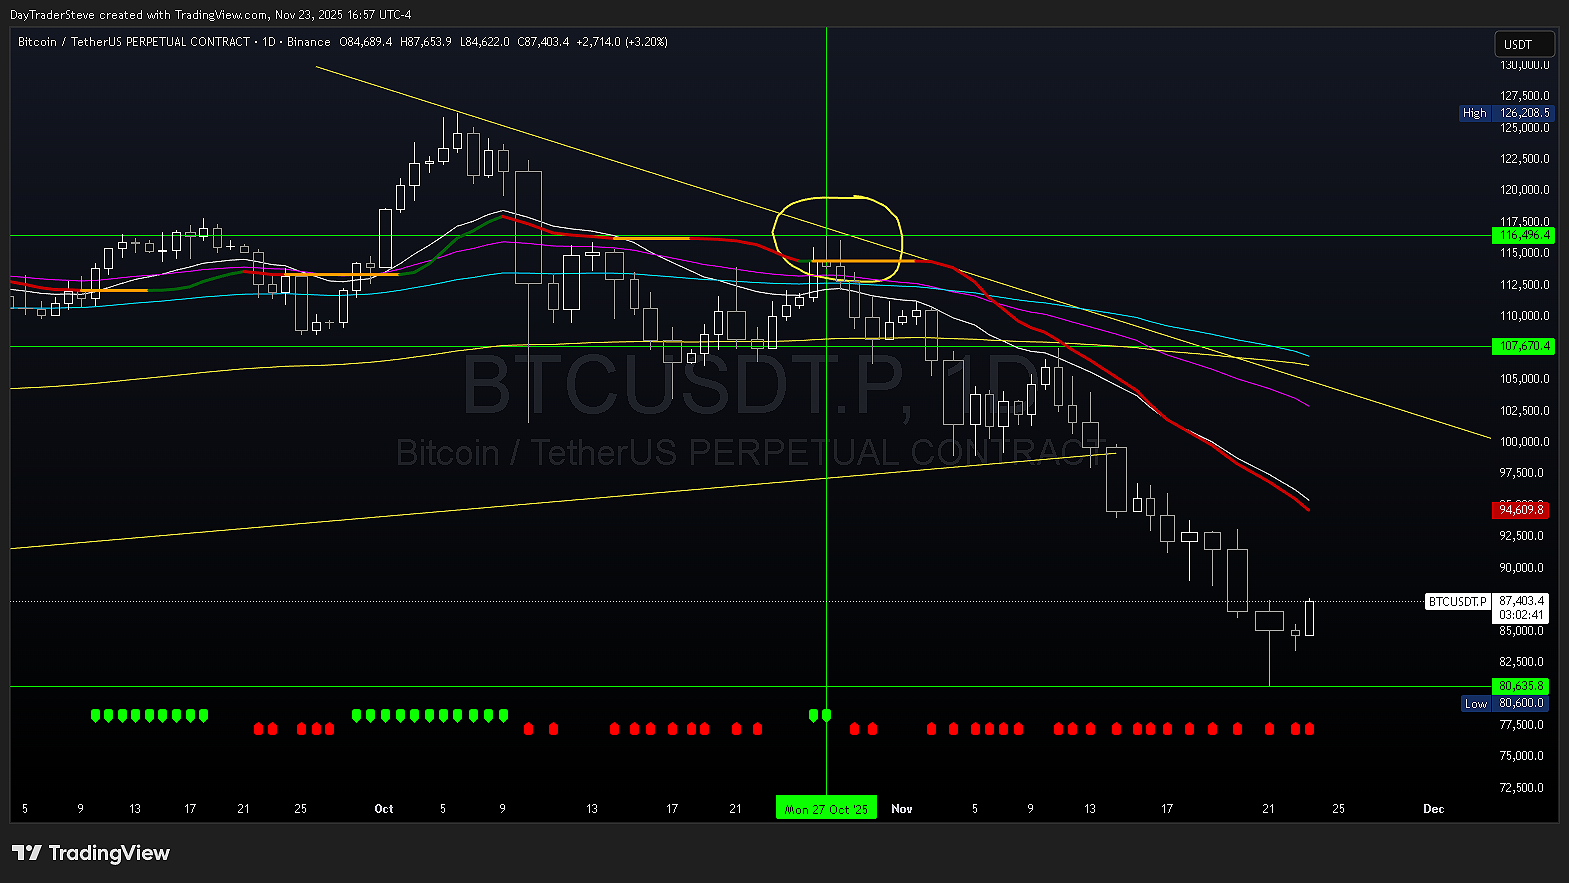
Looking at my chart above, you can see the major resistance failure from 10/27 circled in yellow, subsequent cascade down to about $100k, where price stalled and tested support for 4 days (long lower wicks) before a final gasping breath up into the $107k green horizontal line area [this points out the price failure which poked just above the 20D EMA (white line) and the Alpha Trendline (red)]
We spent the following 10 days in down-only price action, reaching a wick low of $80.6k, as shown by the low horizontal green line. This was MASSIVE because we lost the long-term $100k psychological support, and ascending yellow trendline.
Last issue we also discussed $ETH and the problematic chart which was showing first warning signs of a 200D EMA rejection around $3,600. Safe to say this came true. Ethereum shit the bed and fell -25% in ONLY two weeks, essentially TWICE as fast as $BTC [which by the way is completely normal and to be expected, ETH is essentially a 2x leveraged chart compared to BTC from a price action perspective].
$ETH 1D
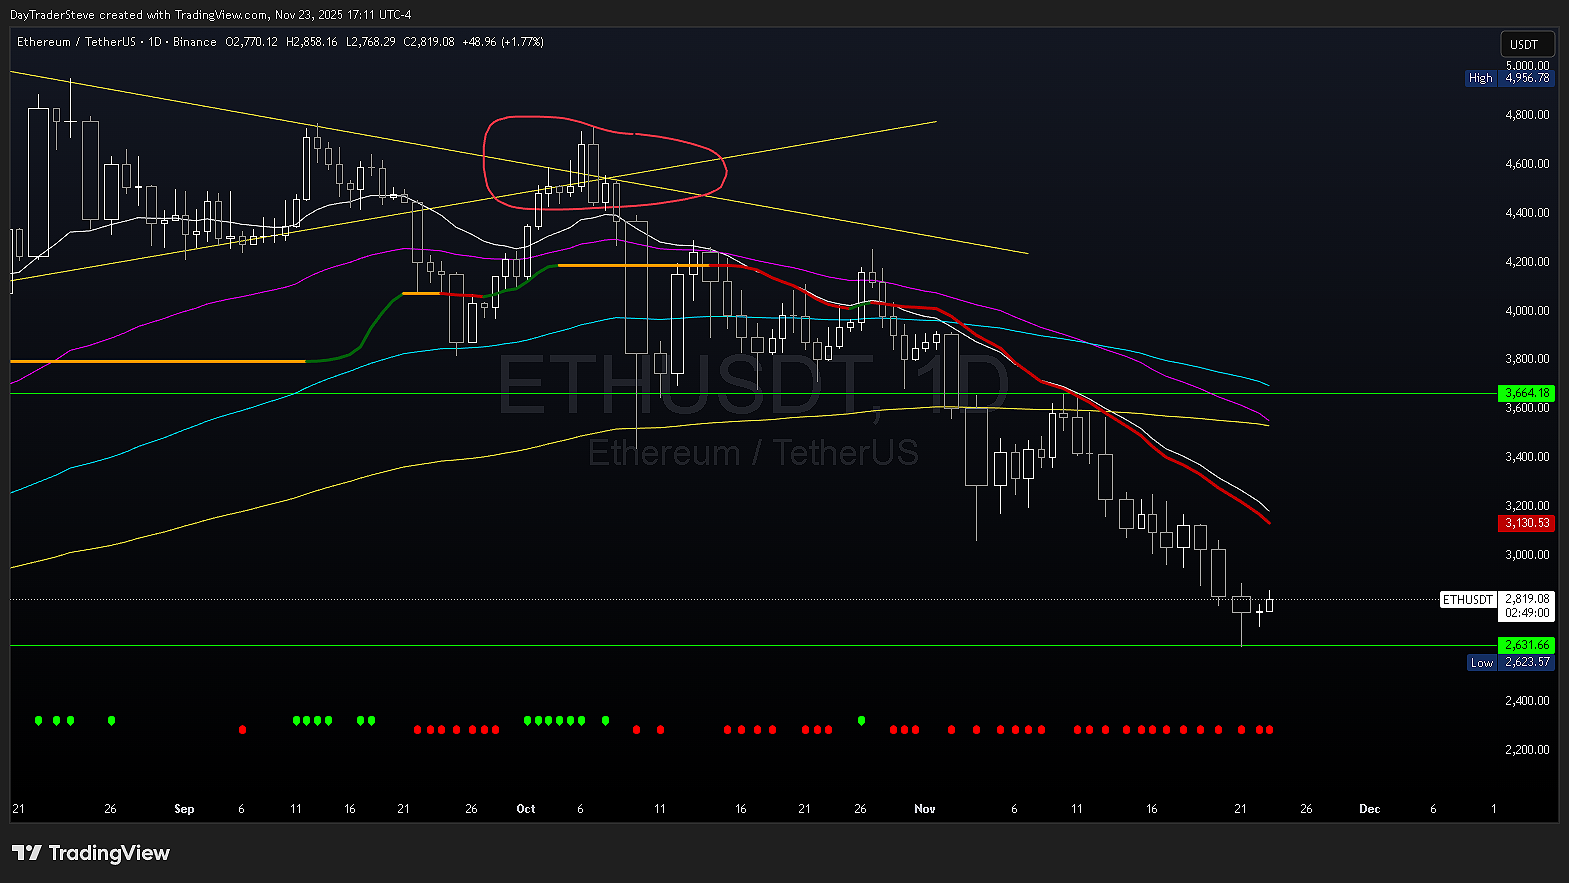
In my chart above you can see the first green horizontal line displaying the $3,600 price rejection which was against MAJOR resistance bands: 200D EMA (yellow curve), 20D EMA (white line), Alpha Trendline (red line). Those 3 levels were intersecting at the exact same time price was retesting those levels, which is almost NEVER a sign of strength or bull momentum. We subsequently puked -$1,000 down into the $2,600 wick (second horizontal green line).
As for the other Alts we discussed last edition, it’s fairly obvious they’ve also been decimated, because if the No. 1 and No. 2 Crypto coins bleed, EVERYTHING else bleeds harder [with very few exceptions].
• So what now?
To point back to my subtitle, everyone (and I mean everyone) is screaming “it’s over, the 4-year cycle is complete”, and we’re about to enter at least a one year bear market. I’ve even seen some respected analysts on Crypto Twitter (X) flip bearish with the crowd, essentially screaming in the same echo chamber. “Macro signal broken” this, “Elliot Wave invalidated” that. This tells me one thing, most people are losing money, seasoned Traders & Investors alike, which means MM’s, Institutions and Whales are winning (as always). And most importantly, it tells me the majority are going to be offside, again.
Now, I will not sit here and guarantee anyone that we’ve bottomed. It is absolutely possible that the crowd has finally cracked the code, and they’ll be right, en-masse, for the first time ever. But there is no fucking way I am taking that bet. Instead, I will illustrate the reasons why I believe we’re approaching a local bottom, at a higher probability than ever.
First things first, did everyone seriously forget that Powell just put a concrete end date on QT (Quantitative Tightening)? ICYMI, December 1st is the official end date of QT. While that doesn’t signal the automatic start of QE, it damn-sure makes it a lot more likely. If you don’t understand these terms, strongly recommend a quick Google brush up.
Secondly, as I mentioned last edition, Trump announced his plans for a fresh round of Stimulus checks, in order to spread the Tariff revenue with US Citizens. Again, I explained what happened last time the US gov’t handed everyone ‘Stimmies. Crypto went on a 12-month face melting run.
So let’s paint a clearer Macro picture:
We’re still seeing FED rate cuts in the near term, reasonable to think in 2026 the US Gov’t has no choice but to begin QE [the exact reasons being an extremely long discussion, but essentially boils down to stabilizing the economy due to mass-job-loss, bank failure, repo / bankruptcy rates, etc.], Trump wants everyone to love him and his ‘Stimmy checks, he will go to ANY length to bail the US out of debt, he HATES when the markets are red, and we’ve seen Institutional adoption of Bitcoin and Crypto at an unprecedented rate.
On that final point alone; when you have the BlackRock’s, Fidelity’s, VanEck’s, Grayscale’s, and Microstrategy’s of the world bullying their way into Bitcoin at MAMMOTH scale, you can bet any semblance of normal structure or cycles ARE OVER.
There is a near zero percent chance that we will simply repeat the same cyclical behavior when retail once dominated the asset. Retail is now the minority, so you must pivot your thesis and pay attention to Institutional charts if you’re going to have any chance of predicting future cycle or chart behavior. For this, I look no further than the SP500.
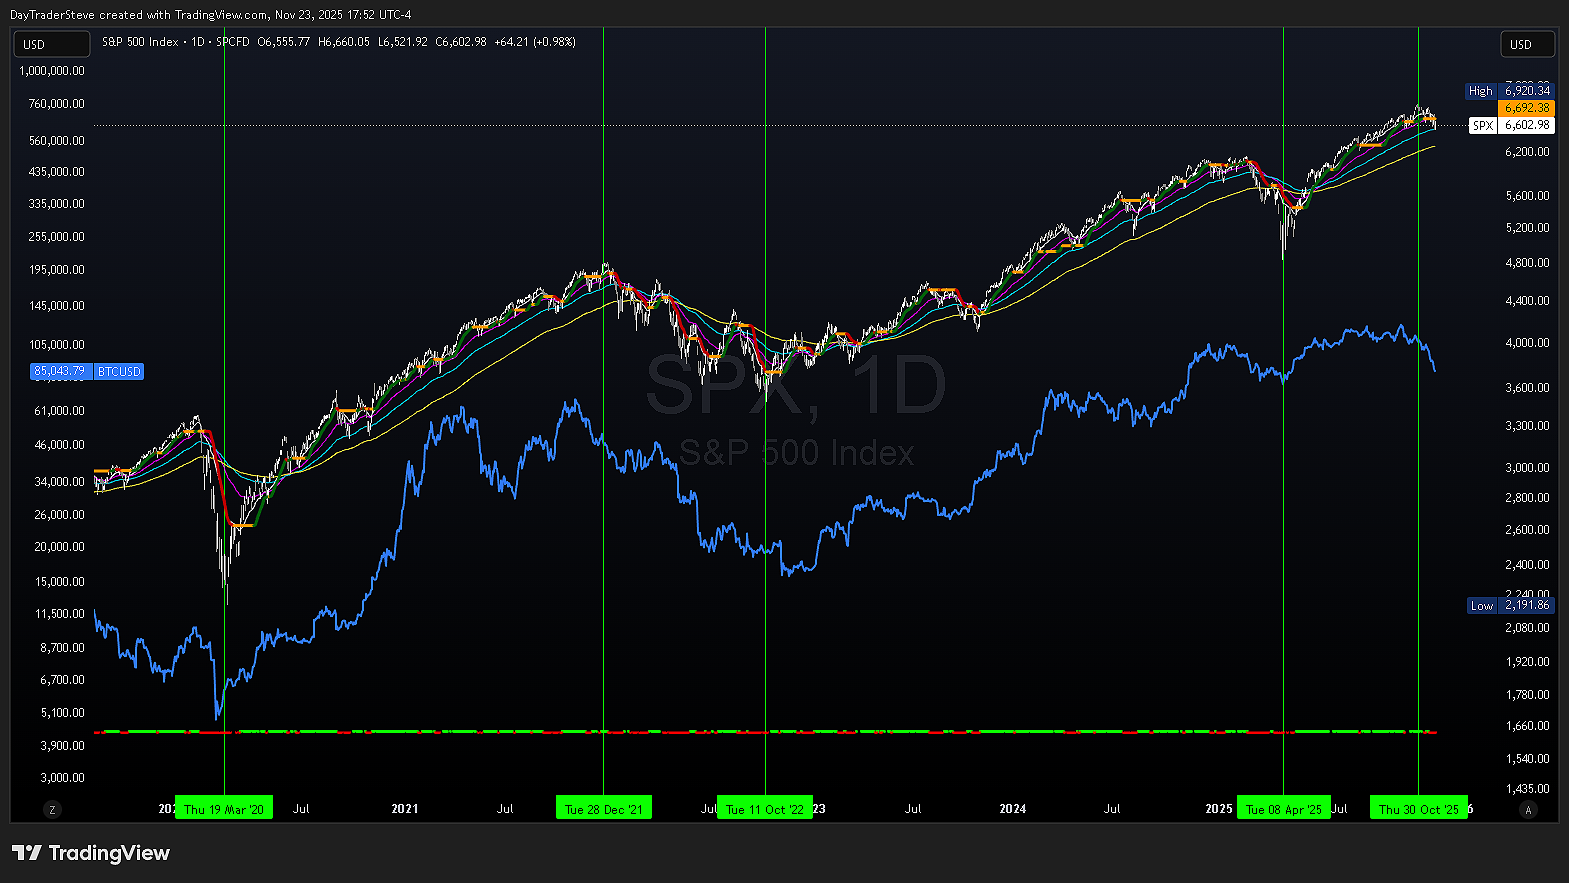
On my above $SPX chart, we have approximately 6 years worth of data, which includes the previous BTC cycle of 2020-2024. There are 5 major vertical horizontal lines pointing out cycle lows and highs.
March 2020, Bitcoin bottomed literal days before the SP500, and both assets rose nearly in unison over the following 420 days (1.16 years) before Bitcoin put in its first local top around $63k. This was the first deviation between BTC & the SPX, it was also during the time of the FTX collapse, which directly influenced Crypto, not the stock market.
December 2021 into Jan 2022, Bitcoin put in its second local top WELL before the SPX topped (approximately 55 days earlier) creating a divergent top which ignited the year long bear market. SPX followed suit, albeit with more volatility and bouncing along the way. BTC fell from highs of $66k down to $16k, -75% in a year. In contrast, the SPX fell from highs of $4,800 down to $3,500, -26% in a year. That’s essentially 3x more downside for BTC.
October 2022, the SPX actually bottomed BEFORE Bitcoin, about 30-50 days sooner. We all know Oct-Nov 2022 was the local bottom across financial markets. Had you bought ANYTHING there you’d be laughing today. Over the following 900+ days (2.5 years) the SPX gained +70% and BTC +575%. Everything wobbled around December-February last winter, SPX crashed -20% in 45 days and BTC -30.6%
April 2025, another local bottom across the board. You could’ve bought SPX at $4,800 and BTC at $75k give or take.
Which brings us to now, the last green vertical line, November 1st 2025, and we’re watching both assets roll over in real time, Bitcoin still leading risk markets approximately ~30 days earlier. BTC is down -36% from it’s $125k ATH, and SPX is down -5%.
Do you see the pattern yet? Bitcoin’s corrections are becoming less severe, the chart looks more similar to the SPX from a structural perspective after 2022, it’s more muted, almost like it’s being guided. Am I saying they are the same? No. I’m saying you cannot deny the Institutional adoption and price patterns which are forming in real time.
Explain it like I’m 5
Hopefully you’ve already put together what I’m trying to argue, that BTC looks poised to mirror the longer term SPX chart patterns, with more “stair stepping” rises and falls. There will absolutely still be volatility to capture, but I personally believe at a much more muted rate.
I believe what we’ve witnessed over the past 30 days is more likely Crypto OG’s who’ve held 3 digit entry prices, exiting into fantastic liquidity for the first time ever. If you held billions worth of Bitcoin a few years ago, what incentive did you have to sell, if your orders nuked the price? Institutions are now HAPPY to buy up every single BTC sold by the early adopters, which protects downside and gives them orderbook liquidity. This is what REAL ADOPTION looks like. For Chrissakes’ we have governments buying the asset!
• Having said all that…
There are invalidation areas and technical zones which would make me wrong on all counts. Let’s review the charts:
BTC 1W
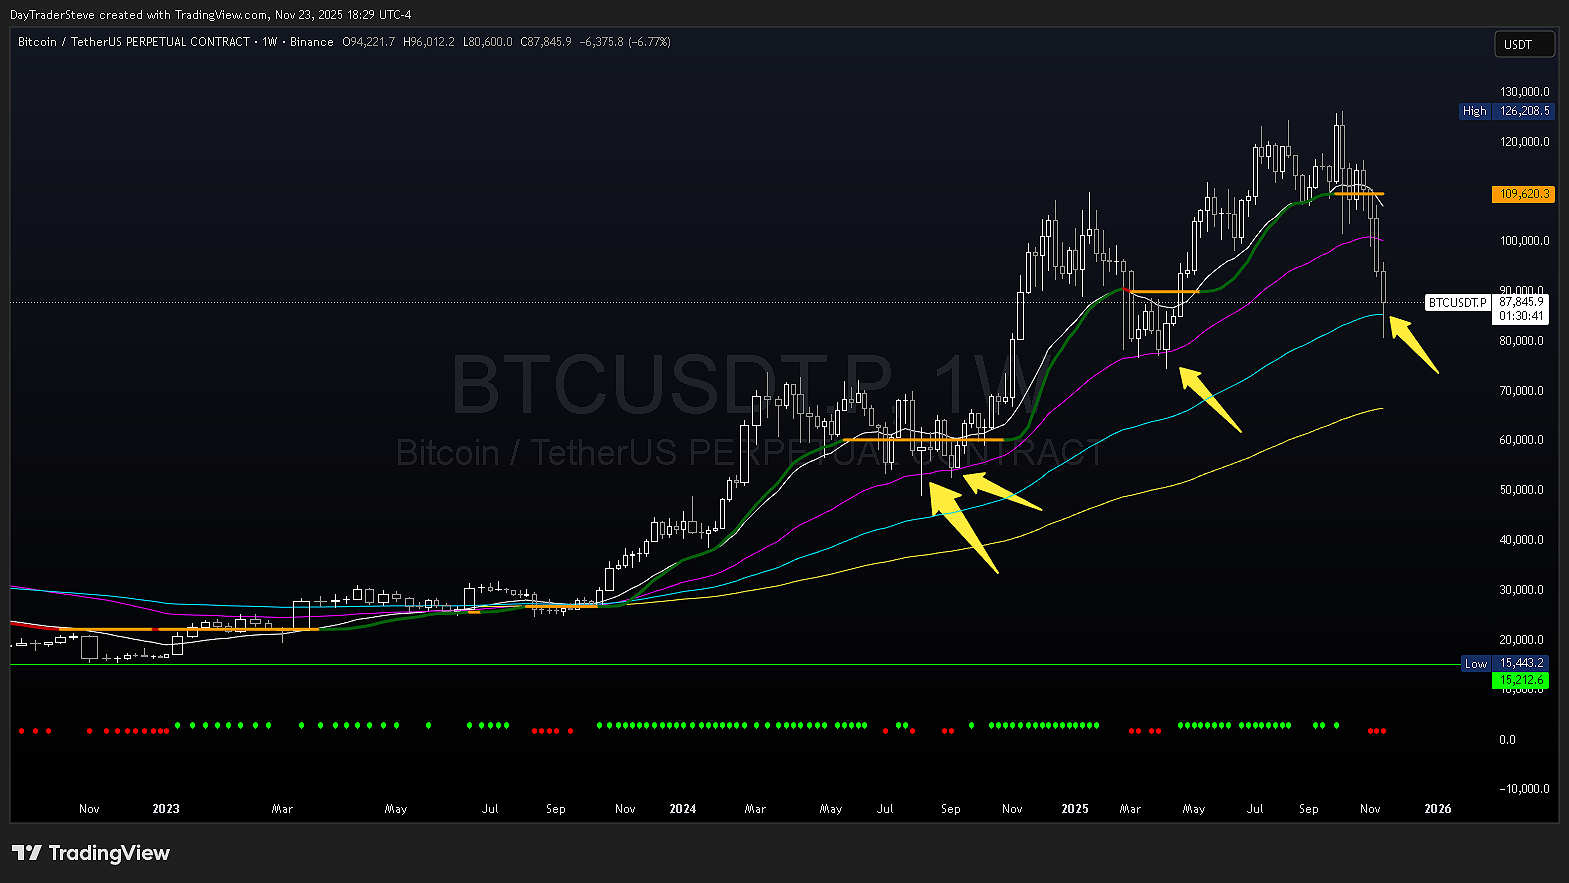
On my above Weekly Bitcoin chart we have a very interesting potential bottom forming. We’re in fact 90 minutes away from a weekly close well above the 100W EMA. This is a great signal.
Looking at the yellow arrows, if you had bought BTC after any Weekly EMA wick over the past 3 years, you’re in profit AND you would have essentially bought the absolute bottom each time.
Now, if we lose the previous local low price of $75k, things start getting invalidated really quickly, so this is PIVOTAL. It would be very hard to argue we continue a bull run if that price is lost, even if we went down to the 200W EMA and bounced, it would be nearly impossible to run back up from $65k and create new ATHs.
BTC 1M
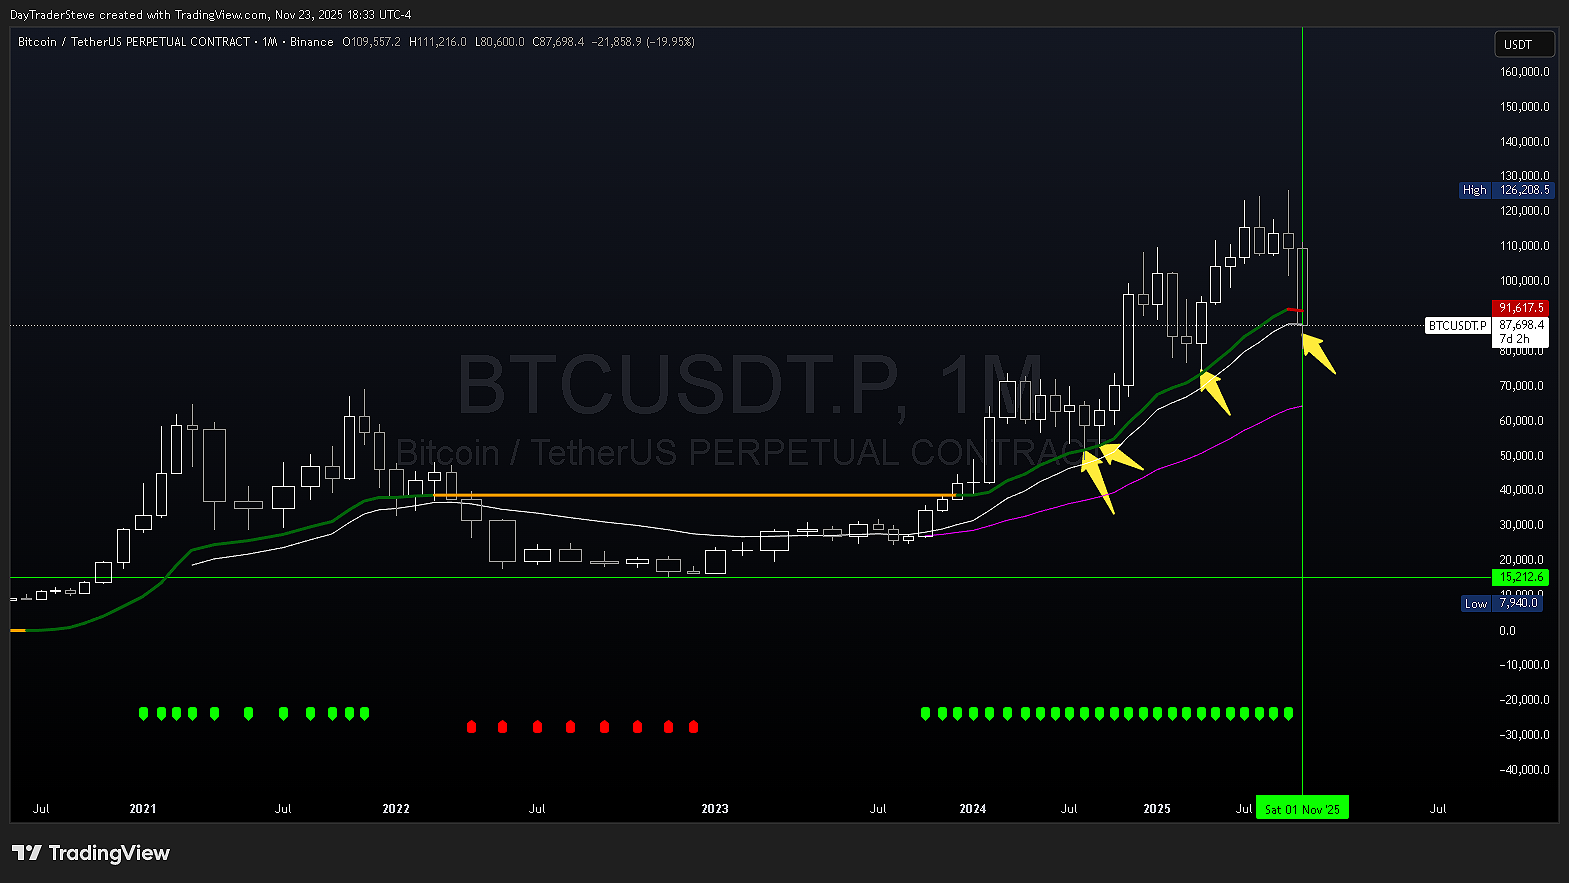
One month is even more interesting. We have 7 days left to close above the 20M EMA, and Alpha Trendline. This is the first month we’ve potentially lost the Green Dots since October 2023. I can’t overstate how important the next few weeklies and monthly close will be.
BTC 1D
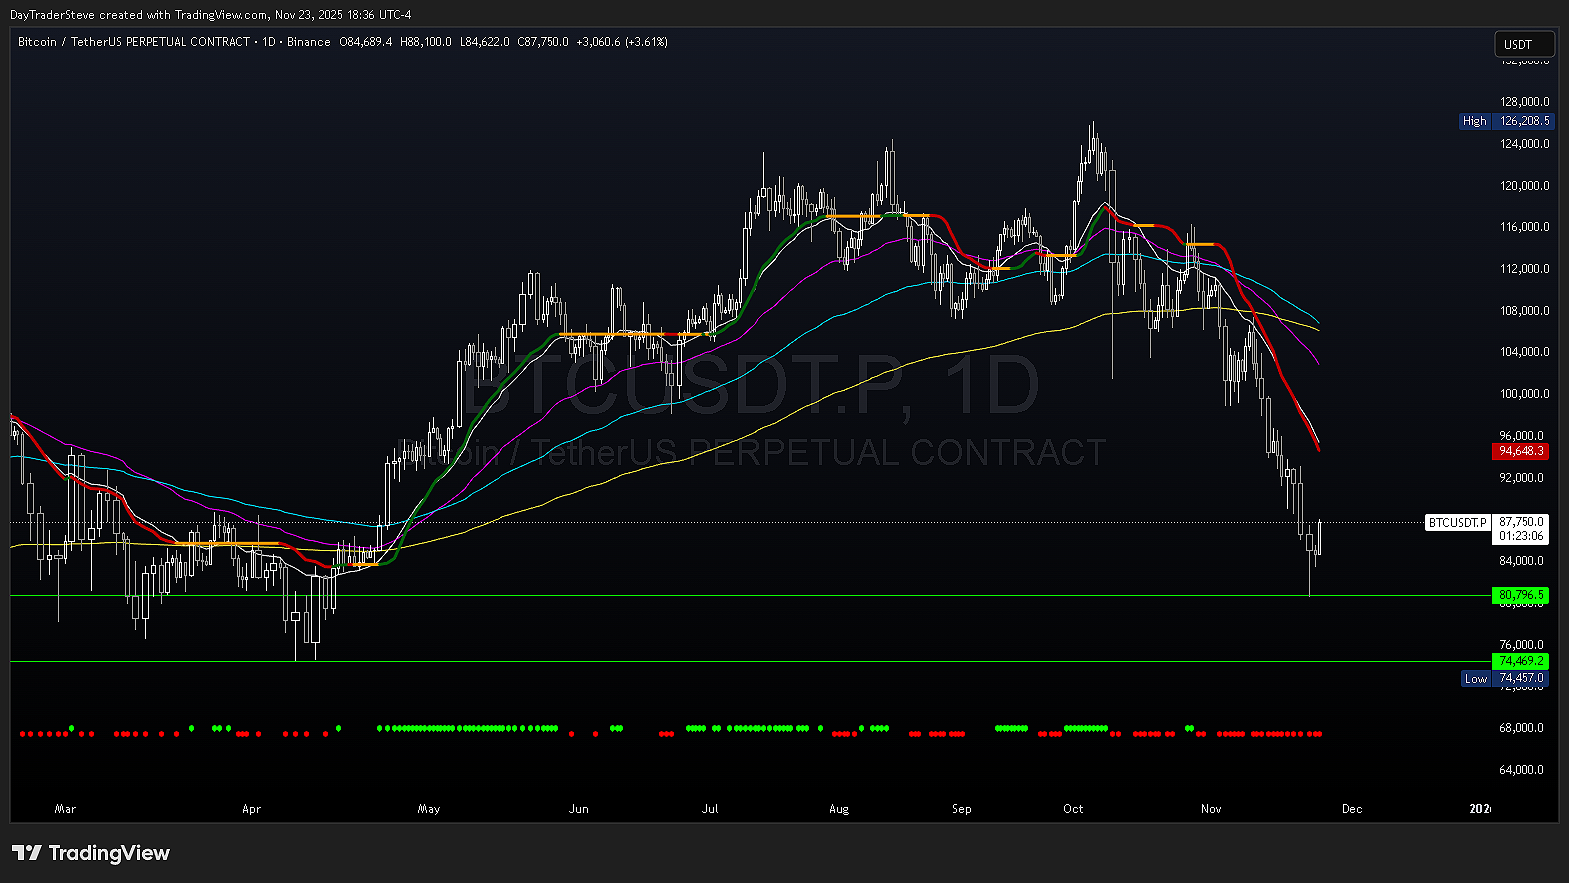
Going back to our Daily Bitcoin chart, we’ve got some work to do. For now, we’ve theoretically made a higher low, which is a good sign for bull market continuity. But we could be looking at weeks of chop, or sideways price action to get through these EMAs. One thing to note, everyone underestimates how violently and QUICKLY Crypto charts can repair themselves and recover. If we see some kind of news or liquidity catalyst, we could blow through these zones.
We’ll firstly need to bounce into $95k zone, and probably reject on first touch, from there we’d need to close higher than $85k and start climbing over the 20D EMA. Based on the curvature of the longer EMAs, it looks like we’re going to find heavy resistance all the way back up to $100k, and if $100k rejects again, you can pretty much guarantee this bull market is toast.
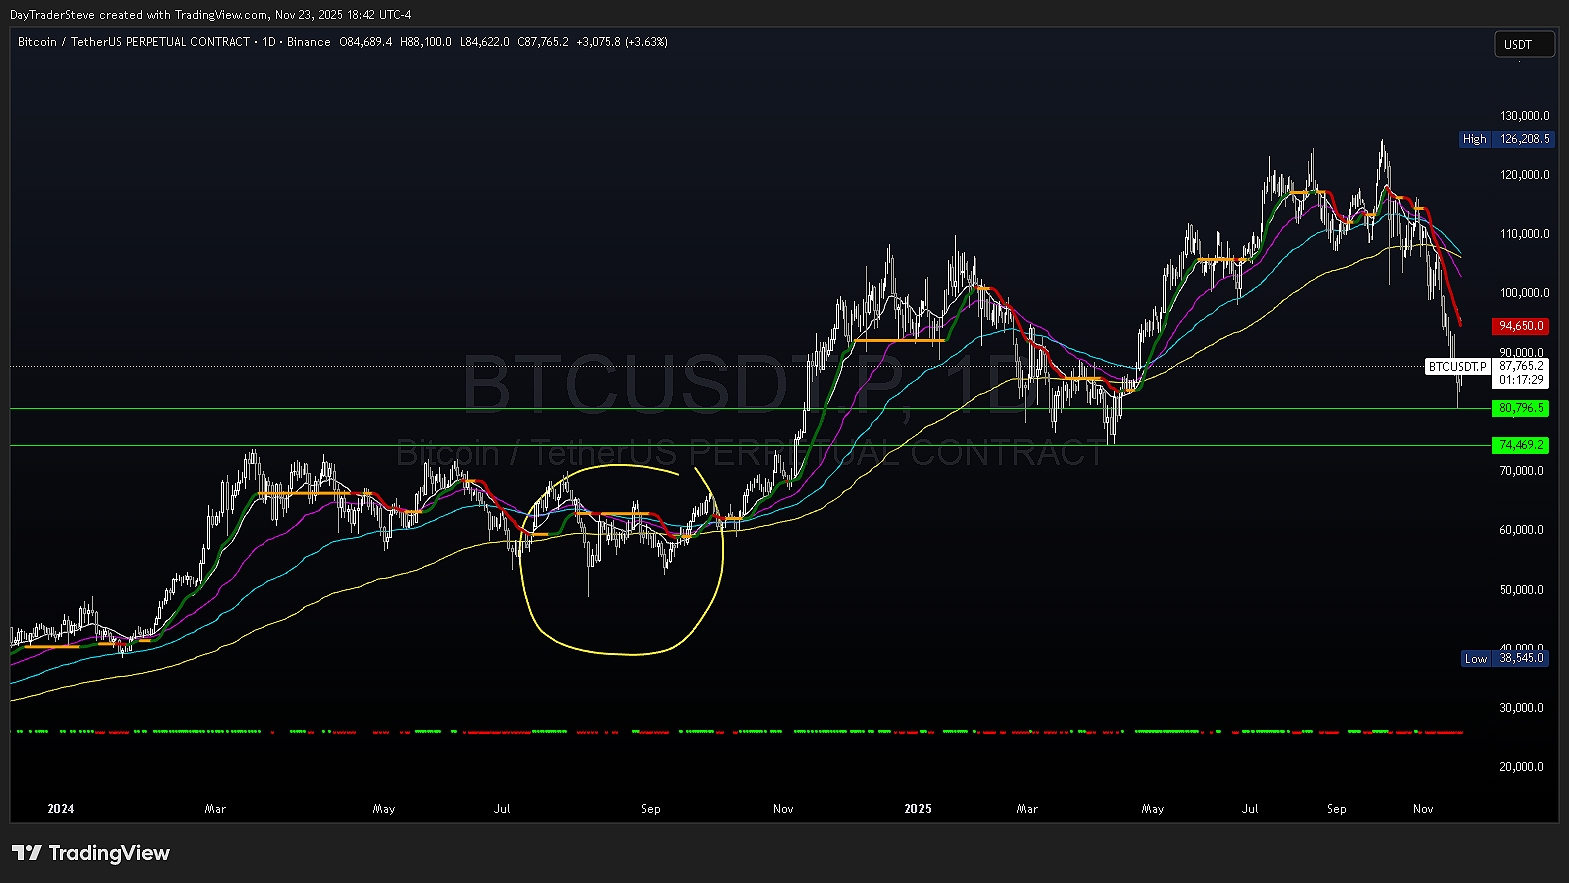
In terms of mental preparation, Bitcoin is known to chop sideways for months on end. We suffered a brutal 7 month accumulation zone between March-September 2024, before finally resolving higher. And, not before the market faked everyone out by wicking down into $50k territory and threatening similar EMA death cross structure.
Market Makers, Exchanges, and Whales are incentivized to push the majority offside because it creates liquidity, which is the exact thesis I’m betting on again. Bitcoin drives the entire Crypto market, so whatever happens to this asset will cascade across the rest. Unless we truly enter an Alt season, where ETH could out perform and run up while BTC chops around sideways. If large players and Institutions start rotating into ETH, this could be the Alt season catalyst everyone has been waiting (longer than ever) for.
If the above liquidity scenarios pan out, such as QE, Trump Stimmy checks, and Institutional step-ladder bidding, then I believe we have a lot of gas left in this bull run. But I am cautiously optimistic at best, based on how fragile these charts look. I’m simply unwilling to accept that the masses are going to be correct about the start of a true bear market.
For me, failure is losing $75k Bitcoin price – which opens its own opportunities to short the bear market. Until then, I will not pivot from my bull thesis.
Until next time, Trade Smart & Reduce your Risk!
—DTS