

Day Trader Steve — Market Flow Newsletter No. 02
[$GOLD blow-off top? Does this mean a $BTC breakout?]

Intro:
It’s been about two weeks since I launched my inaugural newsletter on the heels of the worst mass-liquidation event in Crypto history. If you haven’t read the last edition, I highly recommend catching up on it for context; as we’ll reference it a fair bit moving forward. ICYMI, more than $20B was liquidated from Crypto markets on October 10th — millions of retail Traders lost everything, and virtually everyone who held a leveraged position was wiped out.
Fast forward to today, and it looks like we might be seeing the first signs of true recovery, and the setup required to break-out, thereby continuing this bull run.
Let’s dig into it.
Has $GOLD topped?
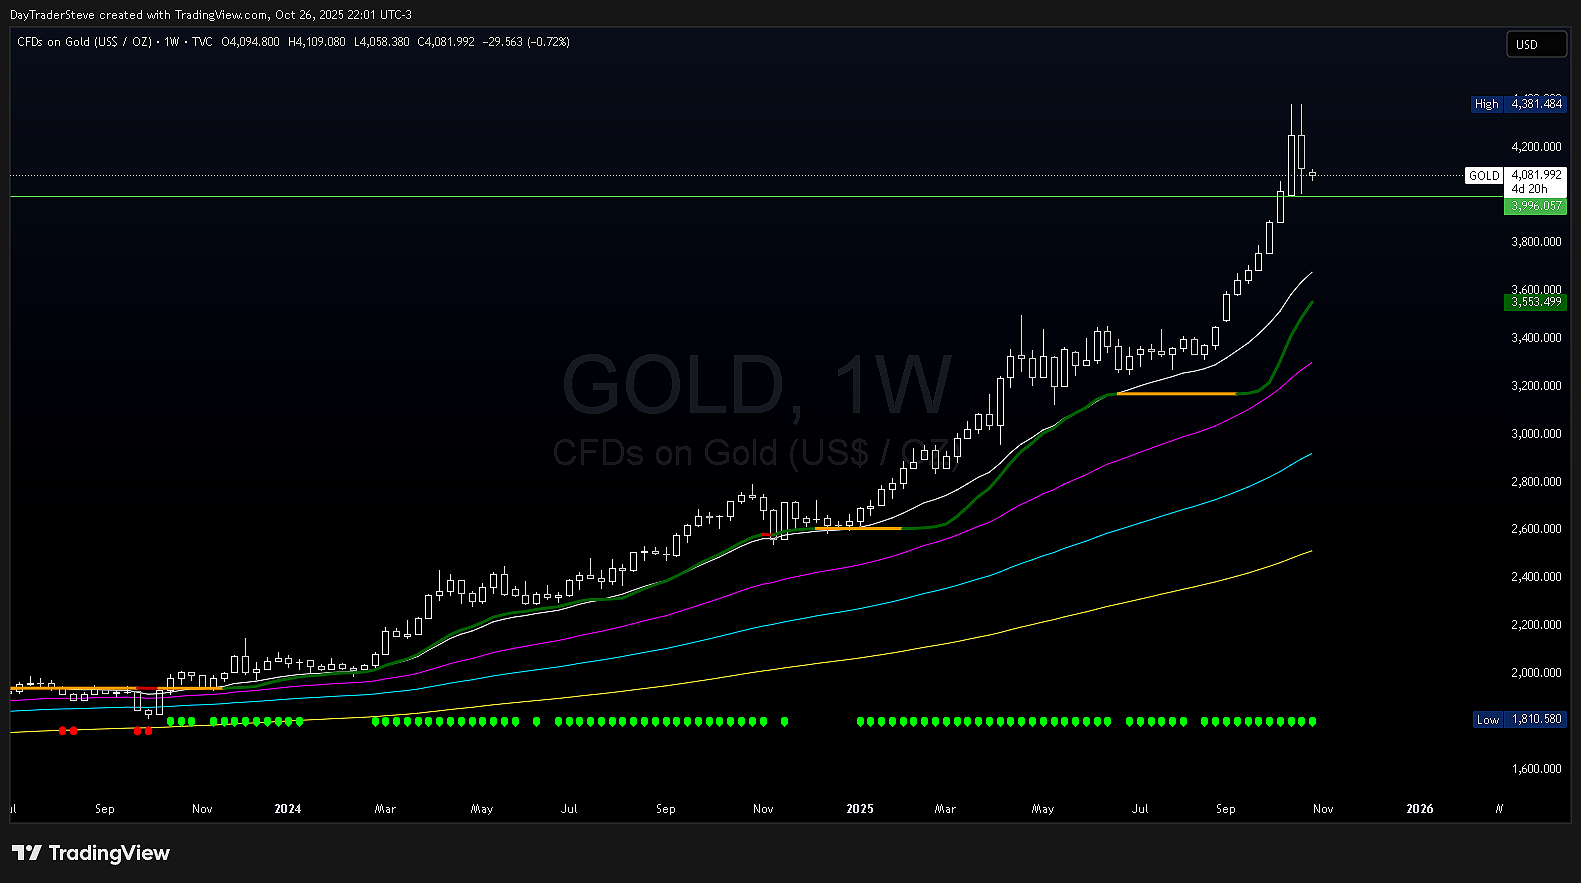
Gold is showing late-stage behavior. If we look at the weekly charts, we don’t yet have a confirmed reversal, but we HAVE received a legitimate reversal on the Daily chart. Why does Gold matter? Because Gold is a RISK-OFF asset, it’s where the world parks its money during extreme uncertainty. BTC is still a risk-on asset, and more closely tied to the S&P500. This isn’t to say both can’t rise at the same time, but if Gold is topping here, it’s potentially a great sign for rotation into BTC & risk-on markets in general. We know Bitcoin performs well during Q4 historically…
1 WEEK:
DAILY:
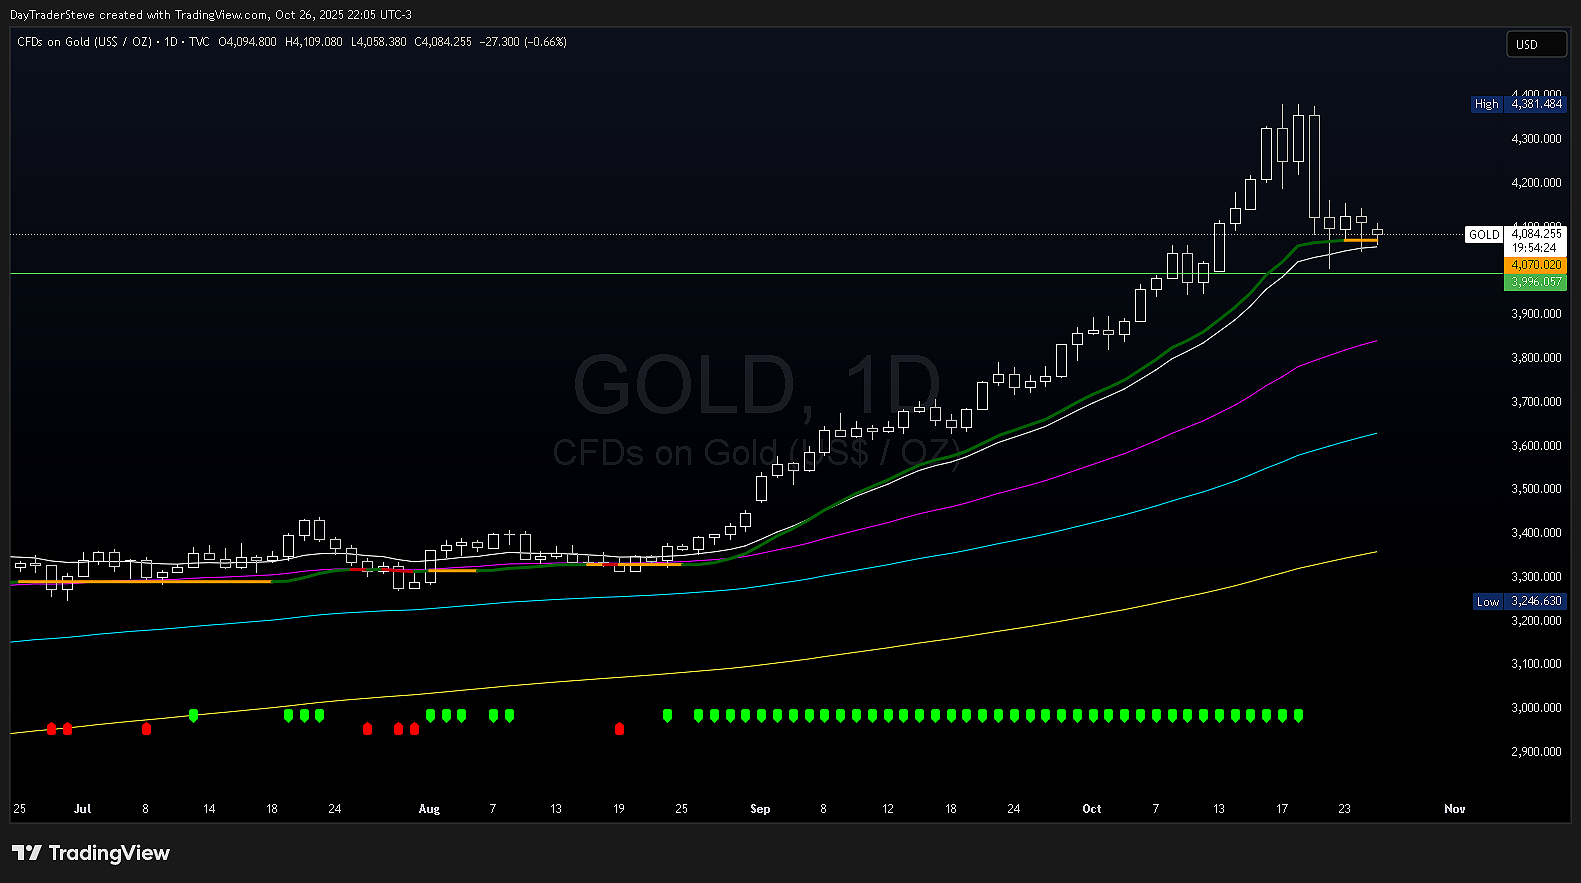
How do you spot this reversal? On the Weekly you can see that the candle did not close below the previous body candle. However on the Daily you can clearly see the top candle fell aggressively through the previous close. This is classified as a “bear engulfing” meaning downward selling pressure engulfed the previous Daily close by a significant margin.
Going one step further, from a technical analysis perspective: we’ve not lost the trendline yet, but a -5% fall on $GOLD in a single day is the largest negative move on the asset in FIVE years. This is NOT a place I would buy Gold. The probability of it being a local top (or even blow-off top) are much higher than anything else.
I won’t truly say the top is in until we lose $4,000 — but we’re close. *Edit* Since writing this last night 10/26/2025 11:00pm EST, Gold has moved down further and is losing the $4,000 price (currently trading at $3,995) this is almost certainly a top confirmation if it closes here today.
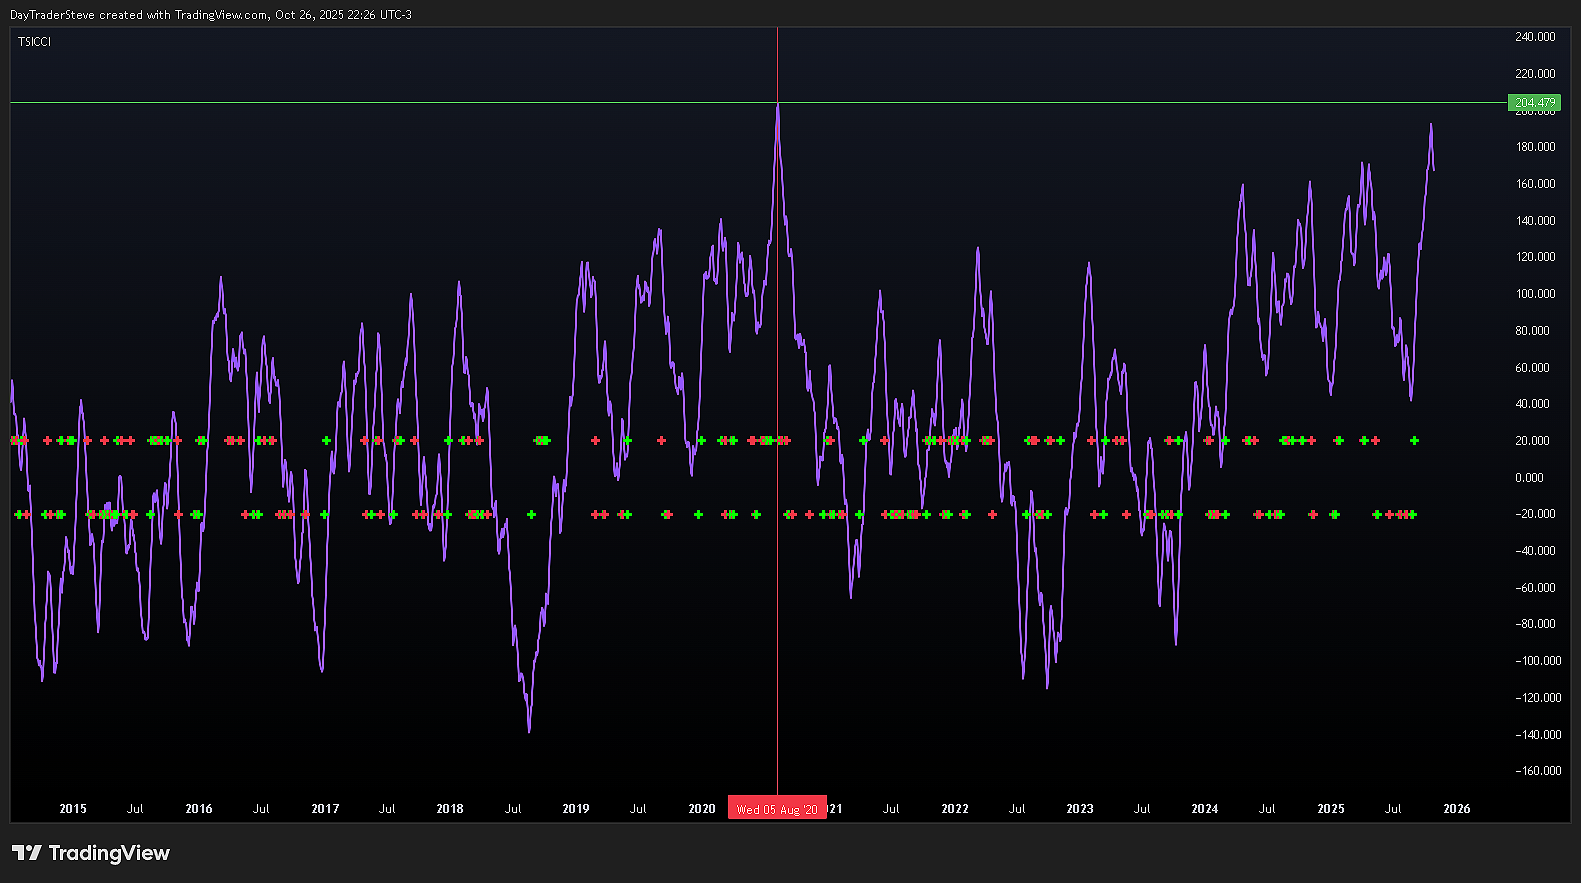
For extra context, the last time Gold showed >200 on the TSICCI was August, 2020. Gold subsequently fell -18.75% over the next 214 days, and then chopped around for another THREE years before starting its next leg higher. I’ll say again, not a place I want to buy Gold.
So should I sell all my $GOLD and buy $BTC?
Short answer: probably. But there’s nuance here.
On October 10th Bitcoin was relatively unharmed. Compared to the rest of the market it only fell -17% in a single day. Sounds volatile, until you compare it to Alts. All of which fell anywhere between -25% to -80% over the same day.
This liquidation event gave us some interesting data points to analyze on the charts:
Typically when we have these flash (nuke) wicks, it’s common for price to rebound aggressively, and then bleed off, filling at least 50% of that wick. As you can see in the below image, we’ve filled more like 80% of that wick. We crashed to $101.5k, jumped aggressively back up to $115-116k, and over the next week bled back down into the $103-104k range.
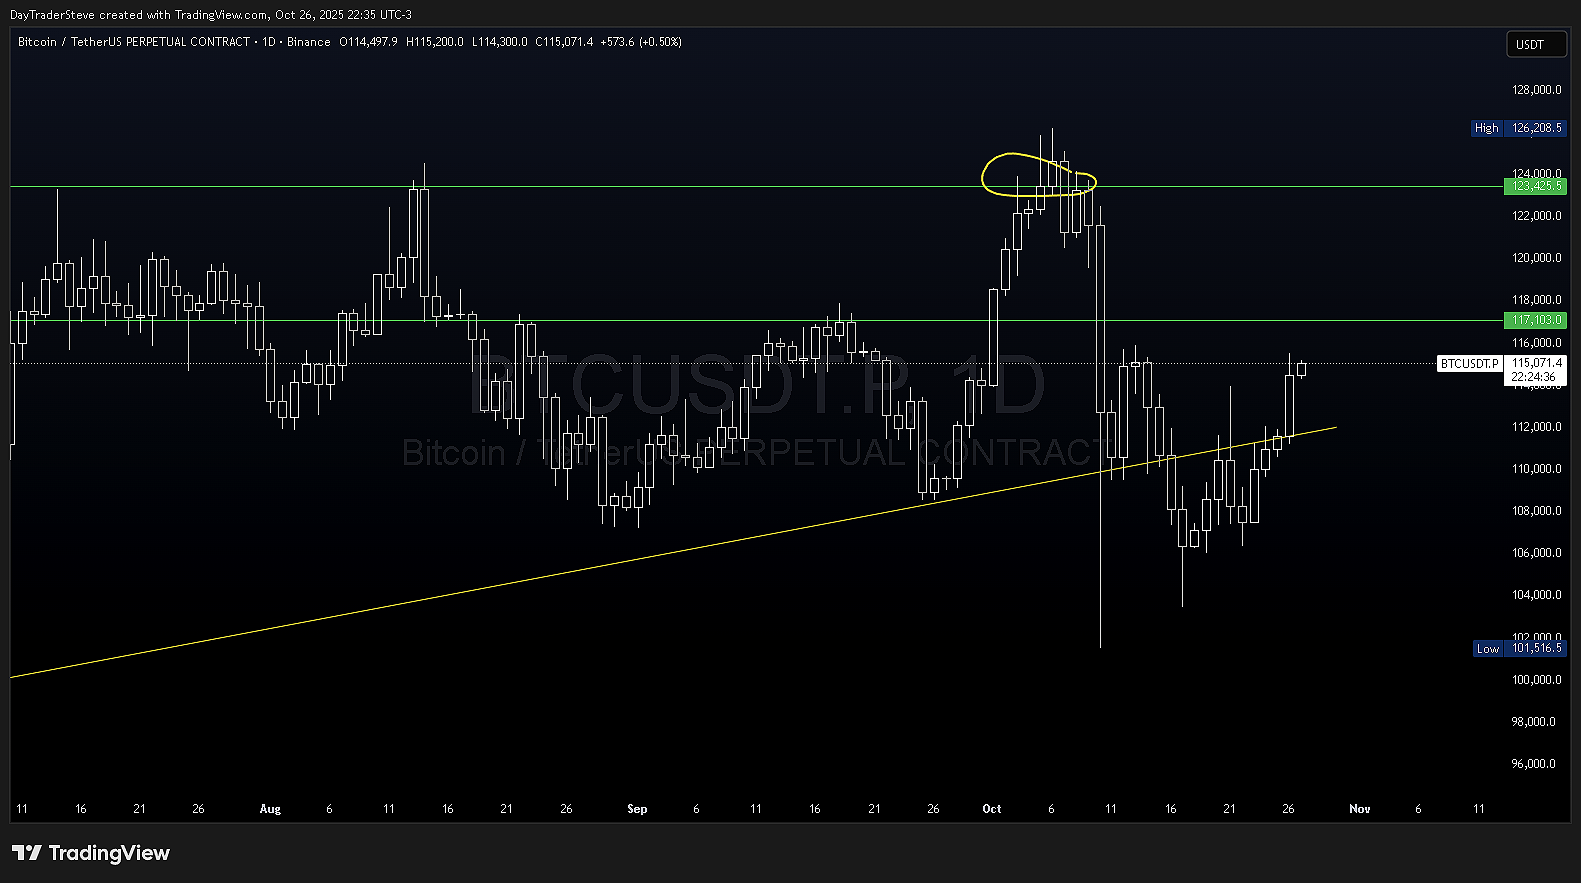
We finished this week on a nice little recovery, getting back up to the $115k range. Now we have some significant resistance levels which MUST be reclaimed in order to confirm Gold holders are rotating into BTC. The good news is our bottom Yellow trendline has been reclaimed. If this rejected, it likely would have been game over.
Next up is $117k, minor horizontal resistance, but still expecting some volatility around there. Would love to see it smashed on first run-through and then turned into support.
And finally, we have the previous ATH (all time high). $123-126k needs to be left behind. Whether we see it break through, bump up against it a few times, and then finally get over it and turn it into support; we can’t confirm anything until that price is taken out. If we get beyond the $125k blocker, it becomes easier to see the case for $150-200k $BTC.
What about my PRECIOUS Alts?!
Don’t panic Gollum. To be sure, some Alts look decimated and I personally can’t see them recovering any time soon. But the majors look alright. Two weeks ago $ETH collapsed -22% and we’ve since put in similar PA (price action) to Bitcoin. We flash recovered from the $3,350 wick, jumping back up to $4,300 before bleeding off back down to $3,600 a few times.
It looks like we’ve put in a proper higher low, and the EMA stack has a chance to turn bullish on the Daily chart. But we’ve got significant resistance ahead. In the below image you’ll see the fake out reversal which should have informed us that a breakdown was coming (Oct 6 + 7).
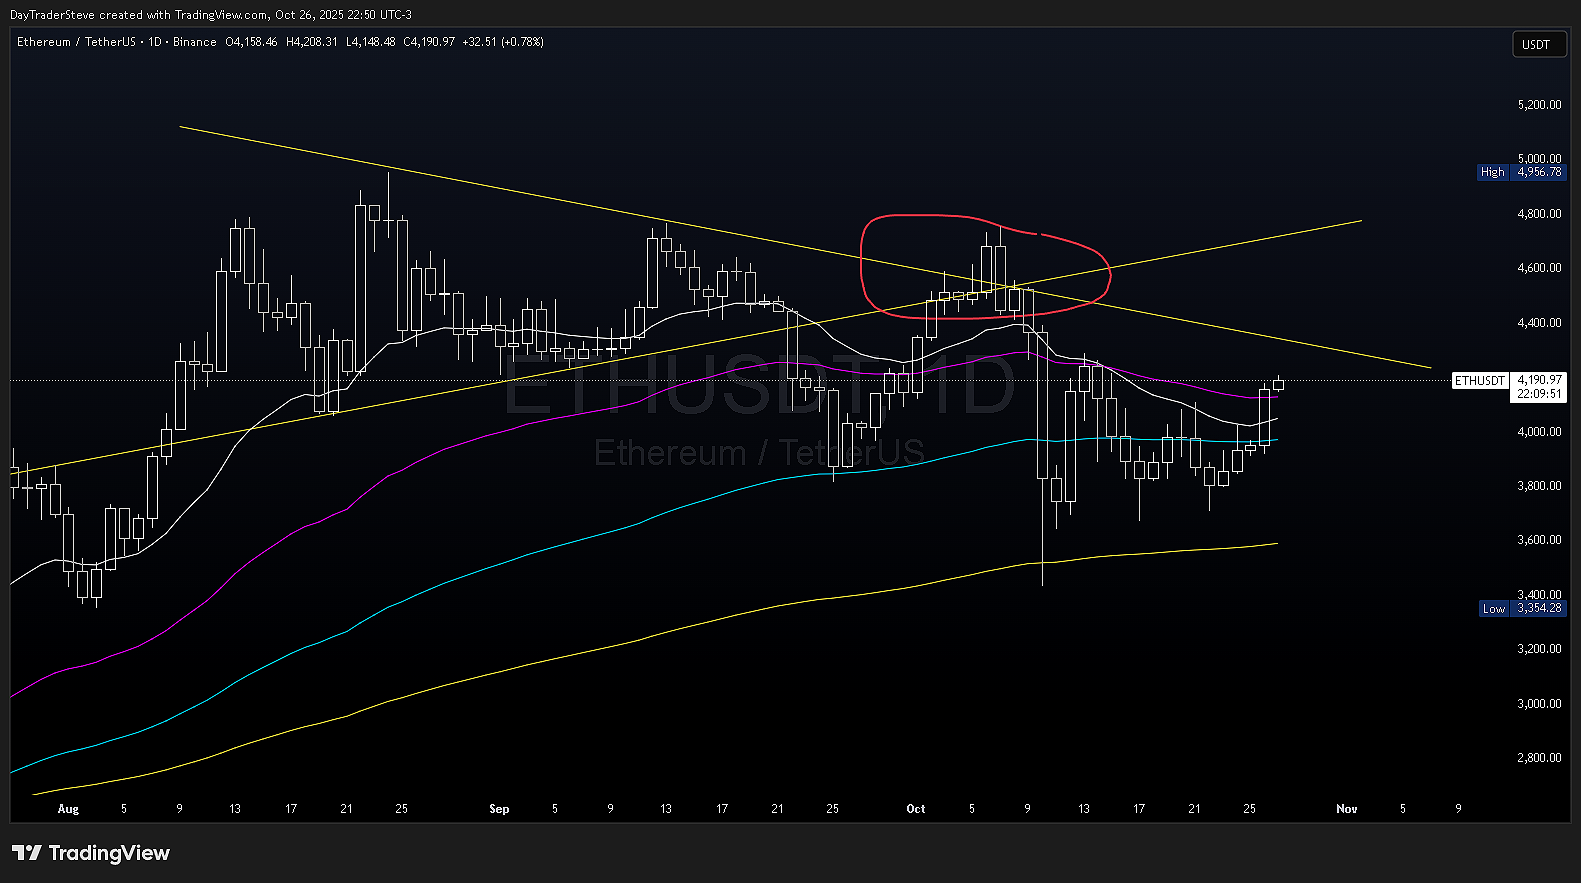
The first brick wall is the descending Yellow trendline sitting around $4,300.
Best case we get through this quickly over the next week or two.
After that, we’ve got our ascending Yellow trendline sitting on the $4,600-4,800 range. And lastly, the previous ATH sits just under the all important psychological and round number of $5,000. Expect a TON of volatility between here and there. There’s always the small possibility of blasting up through these levels, but if we’re playing probabilities this is the lower likelihood.
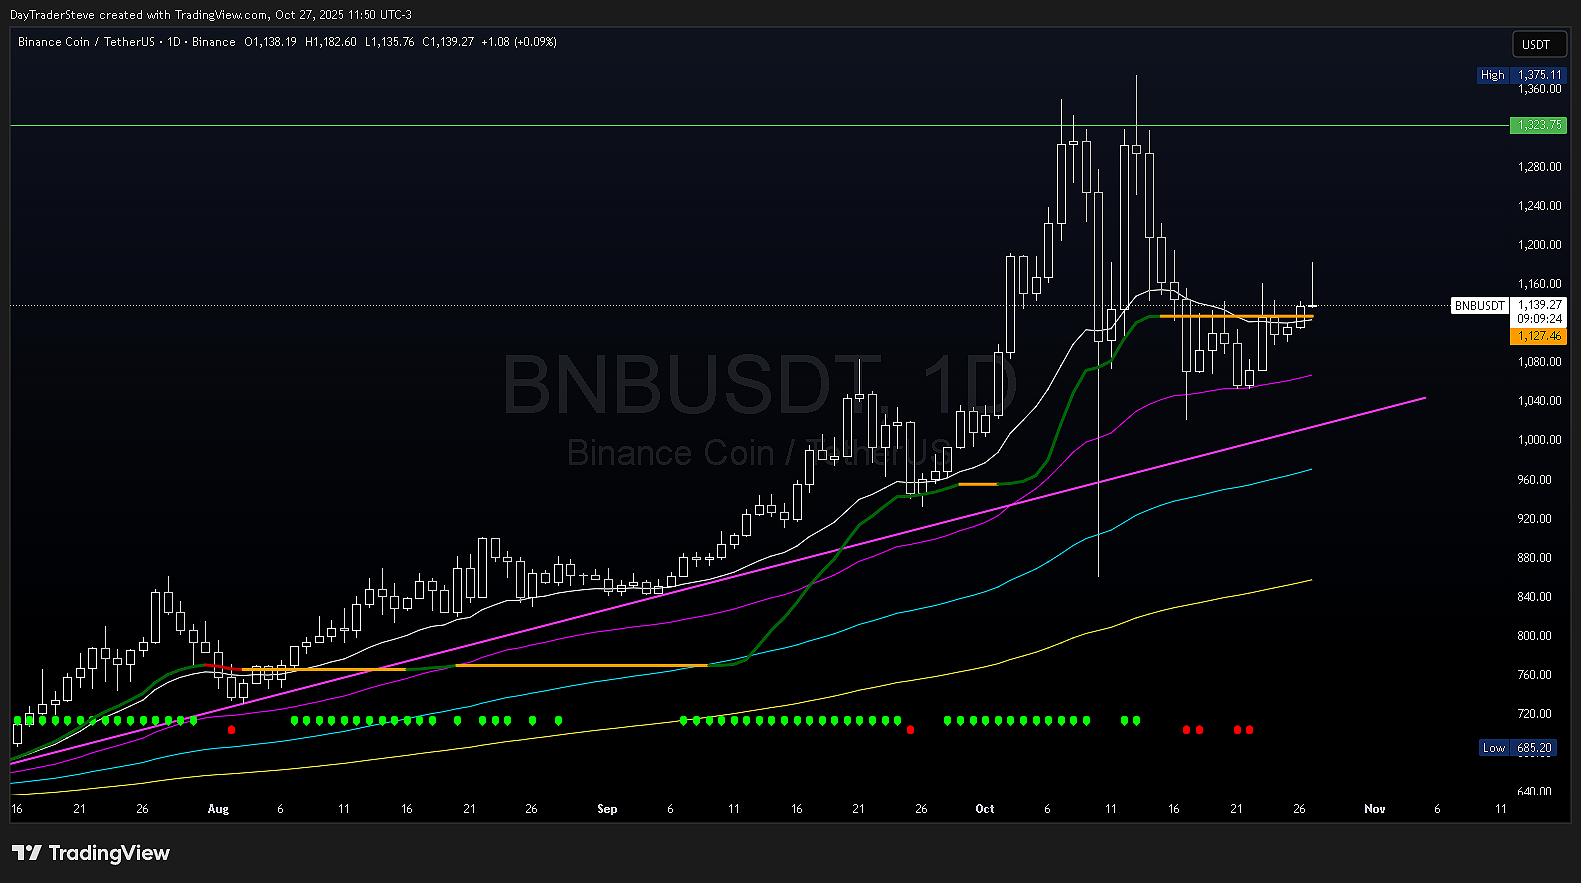
$BNB broke $1,000 for the first time this year as one of the strongest Alts, peaking around $1,300-1,400 and it’s done little since; as arguably one of the strongest movers this cycle. The good news is, it’s accepted the $1,000 price level (for now) which is a large psychological barrier for traders. I expect $5,000 is a similarly strong psychological price level for $ETH, and will therefore lead to volatility. If we can turn $5,000 into support, there is no stopping Ethereum.
You can see below on $BNB the double top which formed against $1,300, we then bled down into the 50EMA ($1,050) and price is attempting to reclaim the Daily trendline. As one of the strongest movers this cycle I expect we will move beyond the trendline and reclaim the $1,160 zone, but so far today (Monday) it’s struggling to gain acceptance. Mondays are typically days to avoid in the Crypto market. If today closes with a steep upper wick like we are currently seeing (10:52 EST) it would be a bad sign. If we close under the trendline ($1,115) it reopens the possibility for $BNB to move lower, possibly targeting the ascending Pink macro trendline which sits between the 50 & 100EMA. (Exponential moving average)
What’s my position in the market?
Mostly I’m building long positions here with tight stop-losses. There’s a lot of air to gap up through between here and significant price levels, which can be a good opportunity to scalp / swing some gains on your portfolio. But I’m cautiously optimistic (at best). There’s a lot of weight overhead, and it will probably need a catalyst or bullish headline to blast through them all.
Based on what I’m seeing in the charts today, I don’t see a clear setup for higher on anything, and there is a risk that a mass selloff on Gold brings the rest of equities down as a whole, if the market interprets this as extreme fear. If a trade deal is reached between the US & China, that could be a real catalyst to move higher in risk markets.
There’s no such thing as easy mode in Crypto.
So as always, Trade Smart, and Reduce your Risk!
—DTS